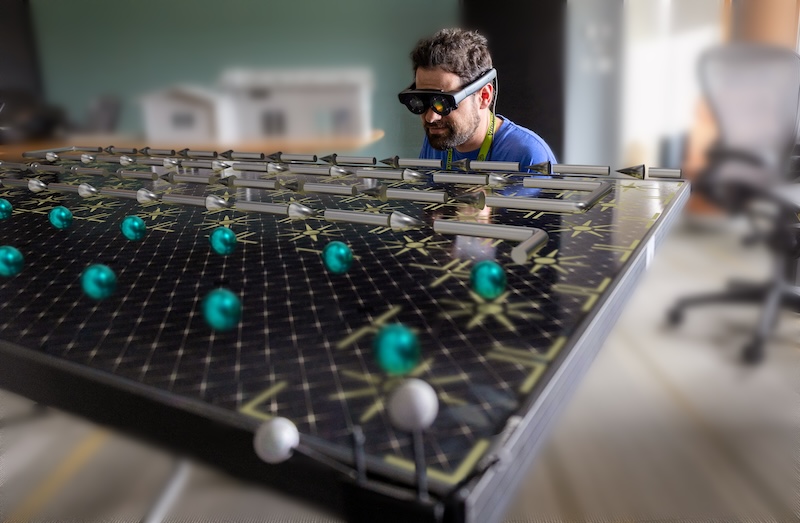
The rapid growth of the solar energy industry requires advanced educational tools to train the next generation of engineers and technicians. We present a novel system for situated visualization of photovoltaic (PV) module performance, leveraging a combination of PV simulation, sun-sky position, and head-mounted augmented reality (AR). Our system is guided by four principles of development: simplicity, adaptability, collaboration, and maintainability, realized in six components. Users interactively manipulate a physical module’s orientation and shading referents with immediate feedback on the module’s performance.
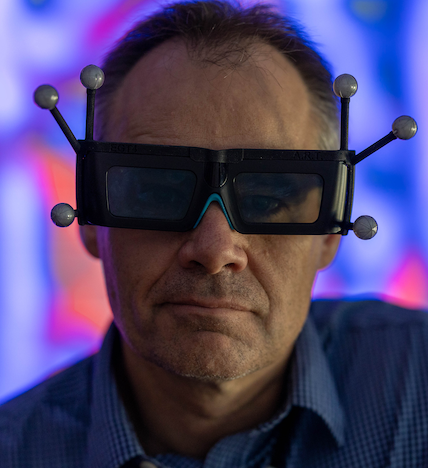
Kenny Gruchalla, Ph.D.
Principal Scientist & Distinguished Member of Research Staff, National Renewable Energy LaboratoryAssistant Professor Adjoint, Computer Science, University of Colorado at Boulder
Affiliate Faculty, RDC, Colorado State University
National Renewable Energy Laboratory
15013 Denver West Parkway Golden, CO 80401-3305
Curriculum Vitae (pdf updated 12/14/25)
Resume (pdf updated 12/14/25)
Publications

Scenario studies are a technique for representing a range of possible complex decisions through time, and analyzing the impact of those decisions on future outcomes of interest. It is common to use scenarios as a way to study potential pathways towards future build-out and decarbonization of energy systems. The results of these studies are often used by diverse energy system stakeholders — such as community organizations, power system utilities, and policymakers — for decision-making using data visualization. However, the role of visualization in facilitating decision-making with energy scenario data is not well understood. In this work, we review common visualization designs employed in energy scenario studies and discuss the effectiveness of some of these techniques in facilitating different types of analysis with scenario data.
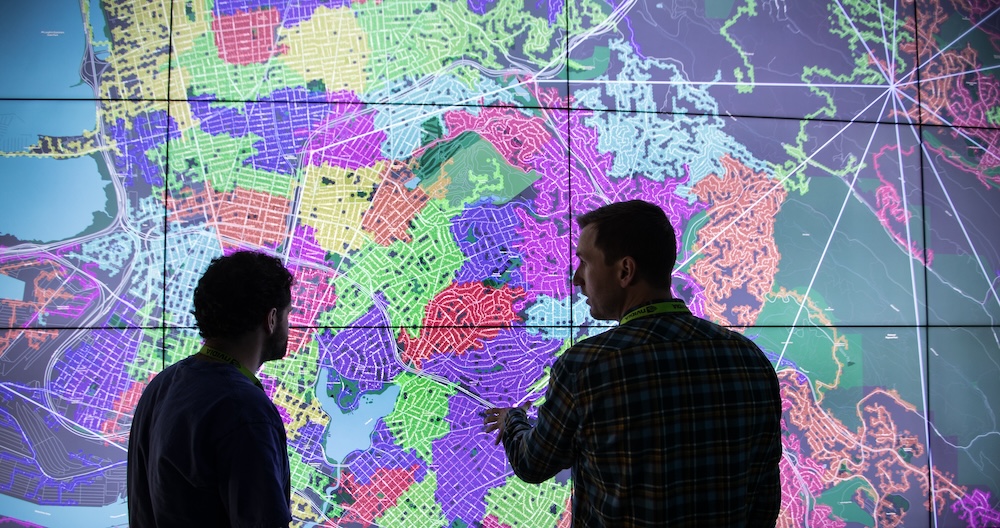
With the growing penetration of inverter-based distributed energy resources and increased loads through electrification, power systems analyses are becoming more important and more complex. Moreover, these analyses increasingly involve the combination of interconnected energy domains with data that are spatially and temporally increasing in scale by orders of magnitude, surpassing the capabilities of many existing analysis and decision-support systems. We present the architectural design, development, and application of a high-resolution web-based visualization environment capable of cross-domain analysis of tens of millions of energy assets, focusing on scalability and performance. Our system supports the exploration, navigation, and analysis of large data from diverse domains such as electrical transmission and distribution systems, mobility and electric vehicle charging networks, communications networks, cyber assets, and other supporting infrastructure. We evaluate this system across multiple use cases, describing the capabilities and limitations of a web-based approach for high-resolution energy system visualizations.
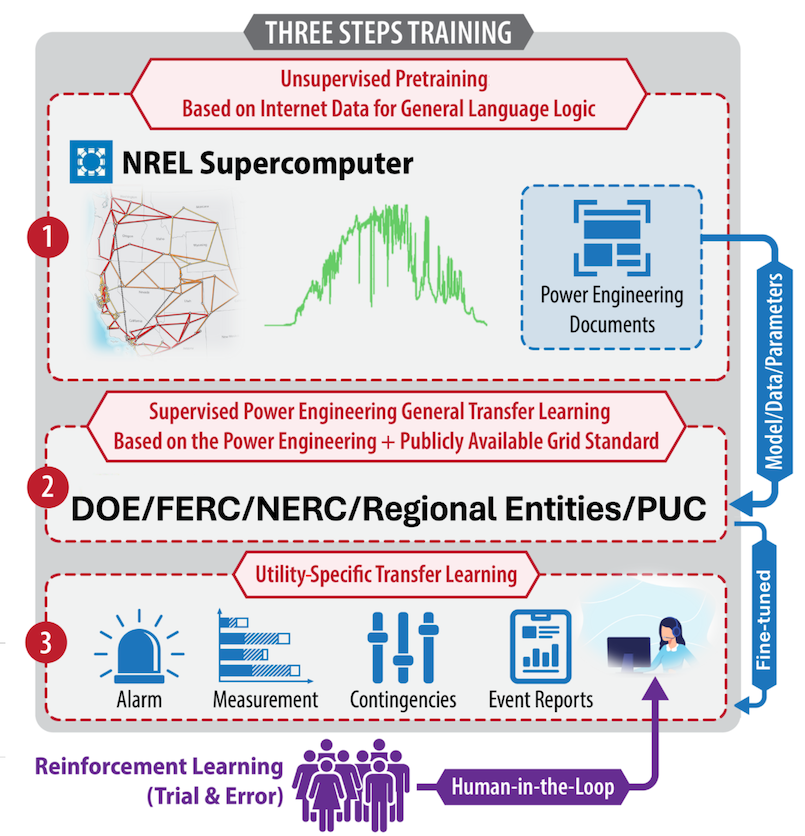
As the power sector transitions, it presents substantial operational and external challenges to grid operators. Inverter-based resources—such as solar, wind, and batteries—introduce new operational challenges because they behave differently from synchronous generators and push the limits of managing increasingly complex networks. Externally, operators must also navigate the grid management challenges of the impacts of increasingly frequent extreme weather events and cyber-attack by hostile nations or other malevolent actors. Grid operators are at the forefront of this shift. These challenges test the ability of grid operators to make real-time decisions safely, efficiently, and reliably while meeting decarbonization goals and evolving customer needs. The critical question that emerges is: How can researchers assist operators’ decision making? One viable approach to assist operators is the broader implementation of artificial intelligence (AI). LLMs, a type of GenAI, are computational tools that excel at language processing and general-purpose tasks. LLMs, such as OpenAI’s GPT-4 or Meta’s Llama 3 (Large Language Model Meta AI), represent a remarkable breakthrough in AI by helping with increasingly complex tasks.
This report describes the first research effort to apply GenAI in the power grid control room. It outlines the synergy between human decision making and eGridGPT, where eGridGPT supports operators by analyzing procedures, suggesting actions, simulating scenarios with physics-based digital twins, and recommending optimal decisions. The system operators can then make decisions on how to adjust the grid or not based on the suggestions. A human system operator is placed in the final decision loop because eGridGPT is not legally accountable or able to automatically implement suggestions. Figure 1 shows an imagined control room of the future with an AI-based assistant to help make suggestions on system operations. The report also presents the results of a preliminary case study showing the ability of eGridGPT to handle an equipment model mapping task between real-time operations and offline planning.
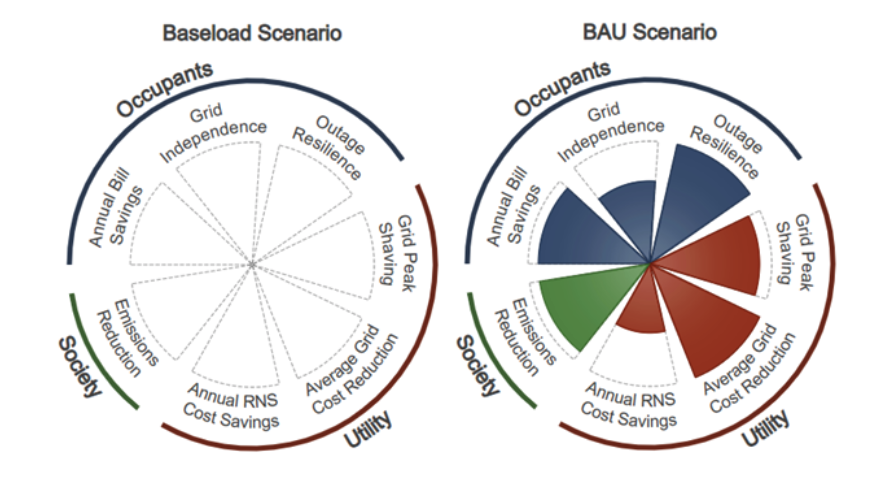
As the U.S. works to meet emissions reduction goals and modernize power sector operations, residential buildings—which account for 21% of the total U.S. electricity consumption—will play a key role. While the bulk power system is becoming increasingly renewable, residential sector efficiency improvements, on-site renewable generation, storage, and other Grid-interactive Efficient Buildings (GEB) technologies will all contribute substantially towards achieving climate goals while maintaining reliable grid operations. The value provided by residential buildings is distributed across multiple stakeholders, including homeowners and occupants, utilities, grid operators, distributed energy resource aggregators, and society at large. However, different value streams are relevant to each stakeholder, resulting in technology valuations and deployments that often lack a holistic quantification of impacts or equitable distribution of benefits. We analyze field data from a deployment of S+S in a community of highly efficient homes. We use this data to quantify value streams of the existing S+S across stakeholders and use modeled results to show how additional value could be derived from these systems. As a unique contribution of this report, we additionally demonstrate how GEB these value streams can be visualized and communicated across stakeholders using a novel scorecard.
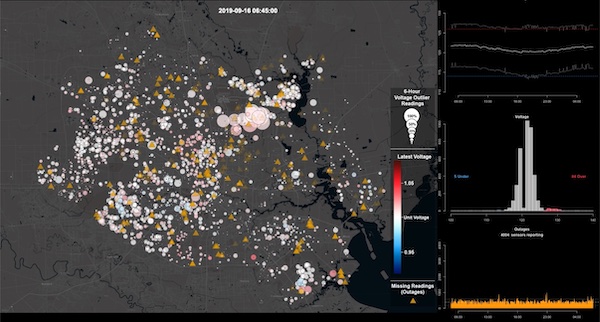
We describe supporting near real-time situational awareness of the electric distribution system by visualizing novel data from voltage sensors deployed on existing broadband cable television network equipment. Our scalable web-based visual analytics platform supports interactive geospatial exploration, time-series analysis, and summarization of grid behavior during potentially anomalous events. The broadband cable television sensor network provides observability of the electrical distribution system at a higher local spatial resolution than is typically available to most utilities, revealing the operational state of the network and aiding in the detection of abnormal behaviors or deviations from expected patterns, particularly across electric utility service areas. We outline the design and development of interactive geospatial and time-series visualization components and the scalable data services that supply metadata, historical, and real-time streams of sensor data across the network. We present our platform during periods of extreme weather, demonstrating its ability to assist in detecting patterns of operation that affect power availability, quality, resiliency, and service restoration.
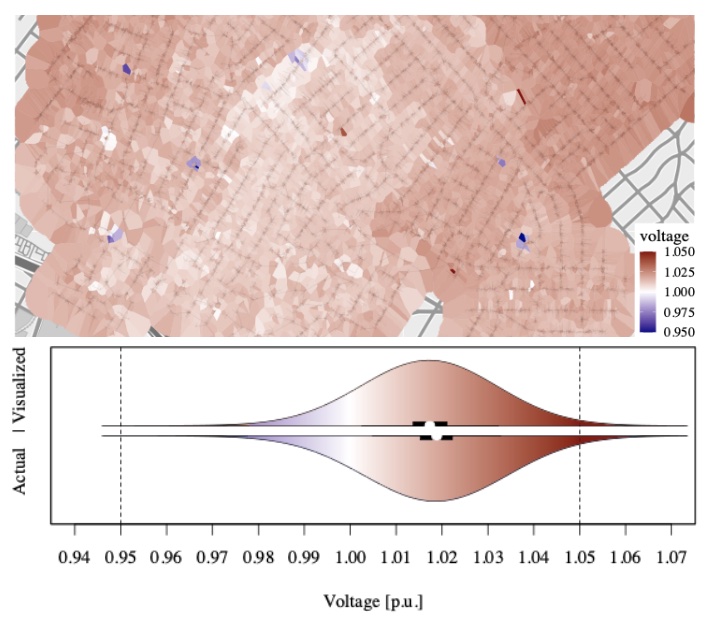
Electrical grids are geographical and topological structures whose voltage states are challenging to represent accurately and efficiently for visual analysis. The current common practice is to use colored contour maps, yet these can misrepresent the data. We examine the suitability of four alternative visualization methods for depicting voltage data in a geographically dense distribution system—Voronoi polygons, H3 tessellations, S2 tessellations, and a network-weighted contour map. We find that Voronoi tessellations and network-weighted contour maps more accurately represent the statistical distribution of the data than regular contour maps.
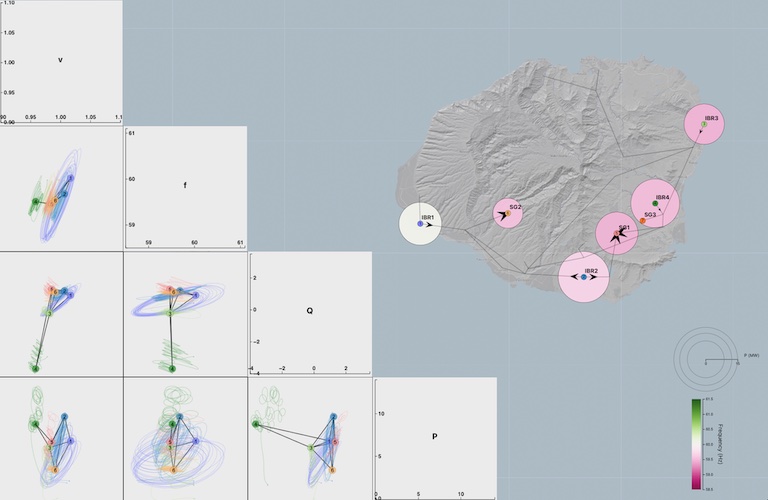
In this work, we discuss the design of visualizations for understanding the complex oscillatory dynamics of an island power system with renewable generation sources after the loss of a large oil power plant. As more renewable generation sources are added to power systems, the oscillatory dynamics will change, which requires new visualization techniques to determine causes and strategies to avoid unwanted behaviors in the future. Our approach integrates geographic views, time-series plots, and novel oscillatory-trajectory curves, providing unique insights into the interdependent oscillatory behaviors of multiple state variables and generators over time. By enabling multi-node and multivariate comparisons over time, users can qualitatively determine drivers of oscillations and differences in generator dynamics, which is not possible with other commonly used visualization techniques.
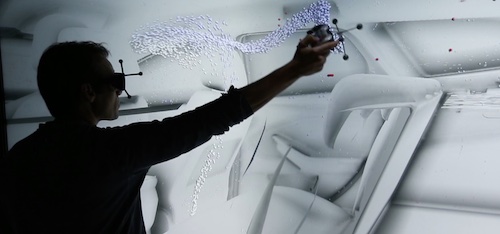
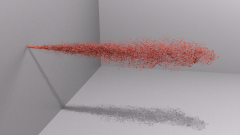
We describe the benefits of immersive flow analysis for three large-scale computational science studies in the field of renewable energy. The studies encompass a range of scales, spanning from the large atmospheric scale of a wind farm to the human scale of an electric vehicle cabin down to the microscopic scale of battery material science. In these studies, users explored the flow patterns and dynamics through immersive particle advection. The integration of high-performance computing with immersive analysis provided a deeper understanding of these systems, helping develop more effective solutions for a sustainable energy future.

Effective visual analytics tools are needed now more than ever as emerging energy systems data and models are rapidly growing in scale and complexity. We examined the suitability of colored contour maps to visually represent bus values in two different power system models: a dense 24k-bus distribution system and a 240-bus transmission system. In a quantitative analysis, we found that contour maps misrepresent power systems data, changing the statistical dispersion of the bus values, including the loss of extreme values. In a controlled empirical study with thirty professional power system research engineers, we found that these distortions significantly impact excursion identification tasks. Additionally, the engineers were less confident in their assessments using contour-based visualizations than glyph-based visualizations.
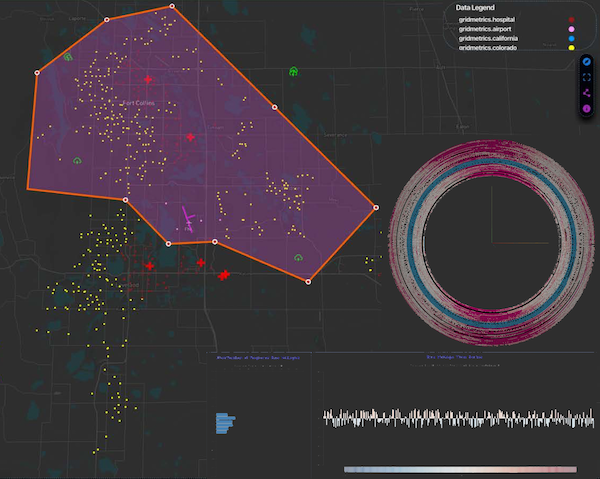
The Situational Awareness of Grid Anomalies (SAGA) project built upon foundational power system tools developed at the National Renewable Energy Laboratory (NREL) integrated with an ever-increasing set of Gridmetrics data extracted from the cable television (CATV) broadband network infrastructure while assimilating other time-series geospatial data and information, such as weather and cyber-physical phenomena, to demonstrate a disruptive technology for power system data analytics relying on existing infrastructure. Three research thrusts supported (1) visual analytics, (2) cyber-physical power system simulation, and (3) anomaly detection. SAGA created technology that leverages, couples, and fortifies two vastly different realms - power and broadband - to increase the resiliency of the power grid in the face of increasing cyberattacks and operational challenges related to integrating DERs. The exploration of potential synergies of broadband-enabled grids resulted in identifying a mutually beneficial symbiosis that can increase the resiliency of both power and broadband services. Broadband networks perform better with reliable power and are good at providing real-time measurements that identify where the grid is under attack, is failing, or is weak. Likewise, sensor-starved distribution grids perform better and can be more reliable when their operation is buttressed with observations of broadband-detected anomalies. Future research can explore broadband’s contribution to continuing to improve grid resiliency, reliability, and cost-effective operation.
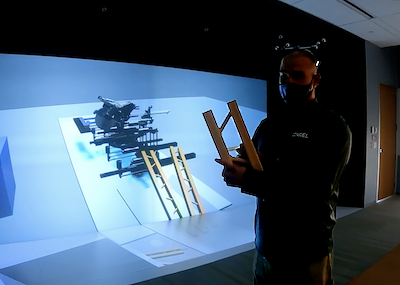
The National Renewable Energy Laboratory is actively developing and testing Immersive Industrialized Construction Environments (IICE) for construction automation and worker-machine interaction to investigate possible solutions and increase workforce productivity. At full scope and matured functionality, IICE allows us to accelerate the development of and better explore industrialized construction approaches such as prefabrication. IICE also enables wider adoption of energy-efficient products and Industry 4.0 construction automation through worker-machine interaction pilots. Industry 4.0 and industrialized construction approaches can encourage workforce specialization in energy efficiency construction, address the lack of multi-skilled workers, and increase workforce productivity with construction automation. However, recent attempts to integrate these concepts with the industry have only been moderately successful. To address this, focusing the pedagogy on using a digital twin, its digital models, and virtual reality could make the experience of continuing education on construction automation more affordable, accessible, scalable, immersive, and safer, and could greatly improve the efficiency and robustness of the building and construction industry. IICE accurately represents the realities of construction uncertainties without having to create full scale physical prototypes of machines. In this paper, we address the following research question: How can a digital twin and its models in virtual reality enhance the learning experience and productivity of energy efficiency construction workers to gain the skills in operating Industry 4.0 components such as construction automation and handling energy-efficient products in industrialized construction factories and on-site? We introduce original research on developing IICE and present preliminary findings from time and motion pilot studies.

Our ability to generate data from simulations and experimental platforms is generally outpacing our ability to analyze those data efficiently and effectively. There are a growing number and variety of possible visualization display modalities, from commodity head-mounted displays to large-scale immersive environments, from desktop and touch displays to high-resolution display walls. Many of these visualization technologies and visual environments are rapidly evolving and could transform analysis for certain classes of complex scientific and engineering data. However, the choice of what technology or combination of technologies to use has historically been largely ad hoc and lacks a carefully validated understanding of how to best utilize different visualization technologies to advance the science. To maximize the impact of our data and analyses, it is imperative that we use the most effective visualization environments for the analysis task at hand.
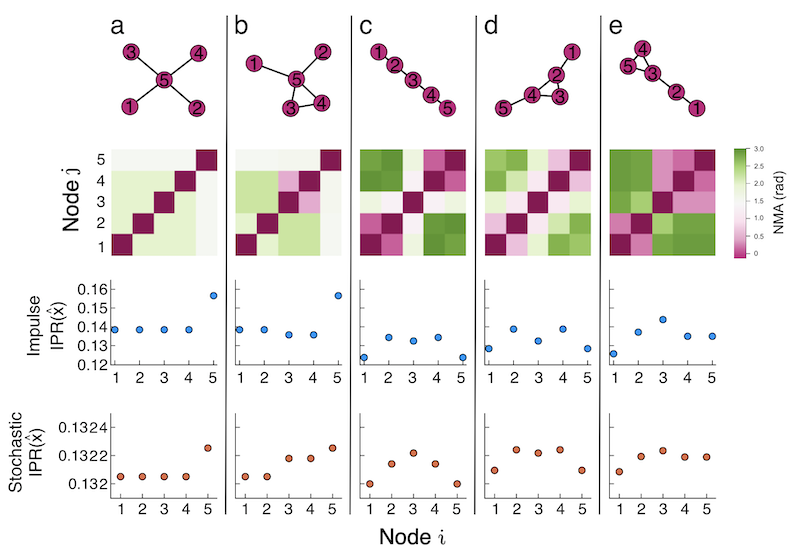
The increase in variable renewable generators (VRGs) in power systems has altered the dynamics from historical experience. VRGs introduce new sources of power oscillations, and the stabilizing response provided by synchronous generators (SGs, e.g., natural gas, coal, etc.), which help avoid some power fluctuations, will lessen as VRGs replace SGs. These changes have led to the need for new methods and metrics to quickly assess the likely oscillatory behavior for a particular network without performing computationally expensive simulations. This work studies the impact of a critical dynamical parameter—the inertia value—on the rest of a power system’s oscillatory response to representative VRG perturbations. We use a known localization metric in a novel way to quantify the number of nodes responding to a perturbation and the magnitude of those responses. This metric allows us to relate the spread and severity of a system’s power oscillations with inertia. We find that as inertia increases, the system response to node perturbations transitions from localized (only a few close nodes respond) to delocalized (many nodes across the network respond). We introduce a heuristic computed from the network Laplacian to relate this oscillatory transition to the network structure. We show that our heuristic accurately describes the spread of oscillations for a realistic power system test case. Using a heuristic to determine the likely oscillatory behavior of a system given a set of parameters has wide applicability in power systems, and it could decrease the computational workload of planning and operation.
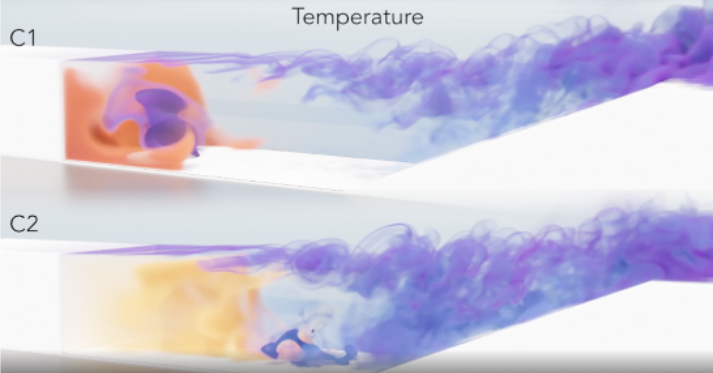
Supersonic combustion has received considerable interest in recent years due to emphasis on hypersonic vehicle development, reusable launch systems and air-breathing rocket engines. Combustion and flame stabilization at high supersonic flows is challenging mainly because of extremely small residence times for fuel-oxidizer mixing and ignition. Cavity-based flameholders are available technique for providing flame-stabilization in these applications. The cavity geometry enables flow deceleration and recirculation thus increasing the residence time for adequate mixing and combustion. Flameholderbehavior varies based on whether fuel is injected upstream of or within the cavity, with both general strategies having been explored in laboratory-scale systems. Injectionupstream of the cavity is a practical solution that provides fuel for flameholding and main engine combustion, but may require high fueling rates for greater mixing within the recirculation zone. Direct fuel injection within the cavity on the other hand provides greater control of local stoichiometry and fuel residence times; however, a theoretical understanding of how turbulent mixing between the fuel jet and air stream influences combustion has not yet been fully developed. The main contribution of this work is to address these interactions via high-fidelity combustion simulations. Our simulations, along with the help of cutting-edge visualization, provide deeper insights on fuel-jet shear-layer interactions within a cavity flame-holder when the injection location is varied, which in turn will enable optimized direct fuel injection strategies.
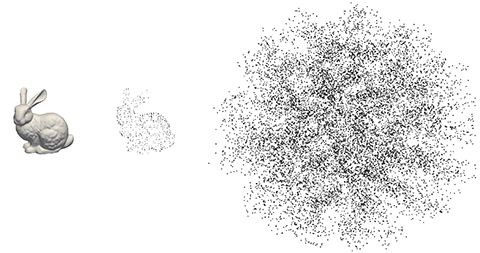
Understanding human perception is critical to the design of effective visualizations. The relative benefits of using 2D versus 3D techniques for data visualization is a complex decision space, with varying levels of uncertainty and disagreement in both the literature and in practice. This study aims to add easily reproducible, empirical evidence on the role of depth cues in perceiving structures or patterns in 3D point clouds. We describe a method to synthesize a 3D point cloud that contains a 3D structure, where 2D projections of the data strongly resemble a Gaussian distribution. We performed a within-subjects structure identification study with 128 participants that compared scatterplot matrices (canonical 2D projections) and 3D scatterplots under three types of motion: rotation, xy-translation, and z-translation. We found that users could consistently identify three separate hidden structures under rotation, while those structures remained hidden in the scatterplot matrices and under translation. This work contributes a set of 3D point clouds that provide definitive examples of 3D patterns perceptible in 3D scatterplots under rotation but imperceptible in 2D scatterplots.
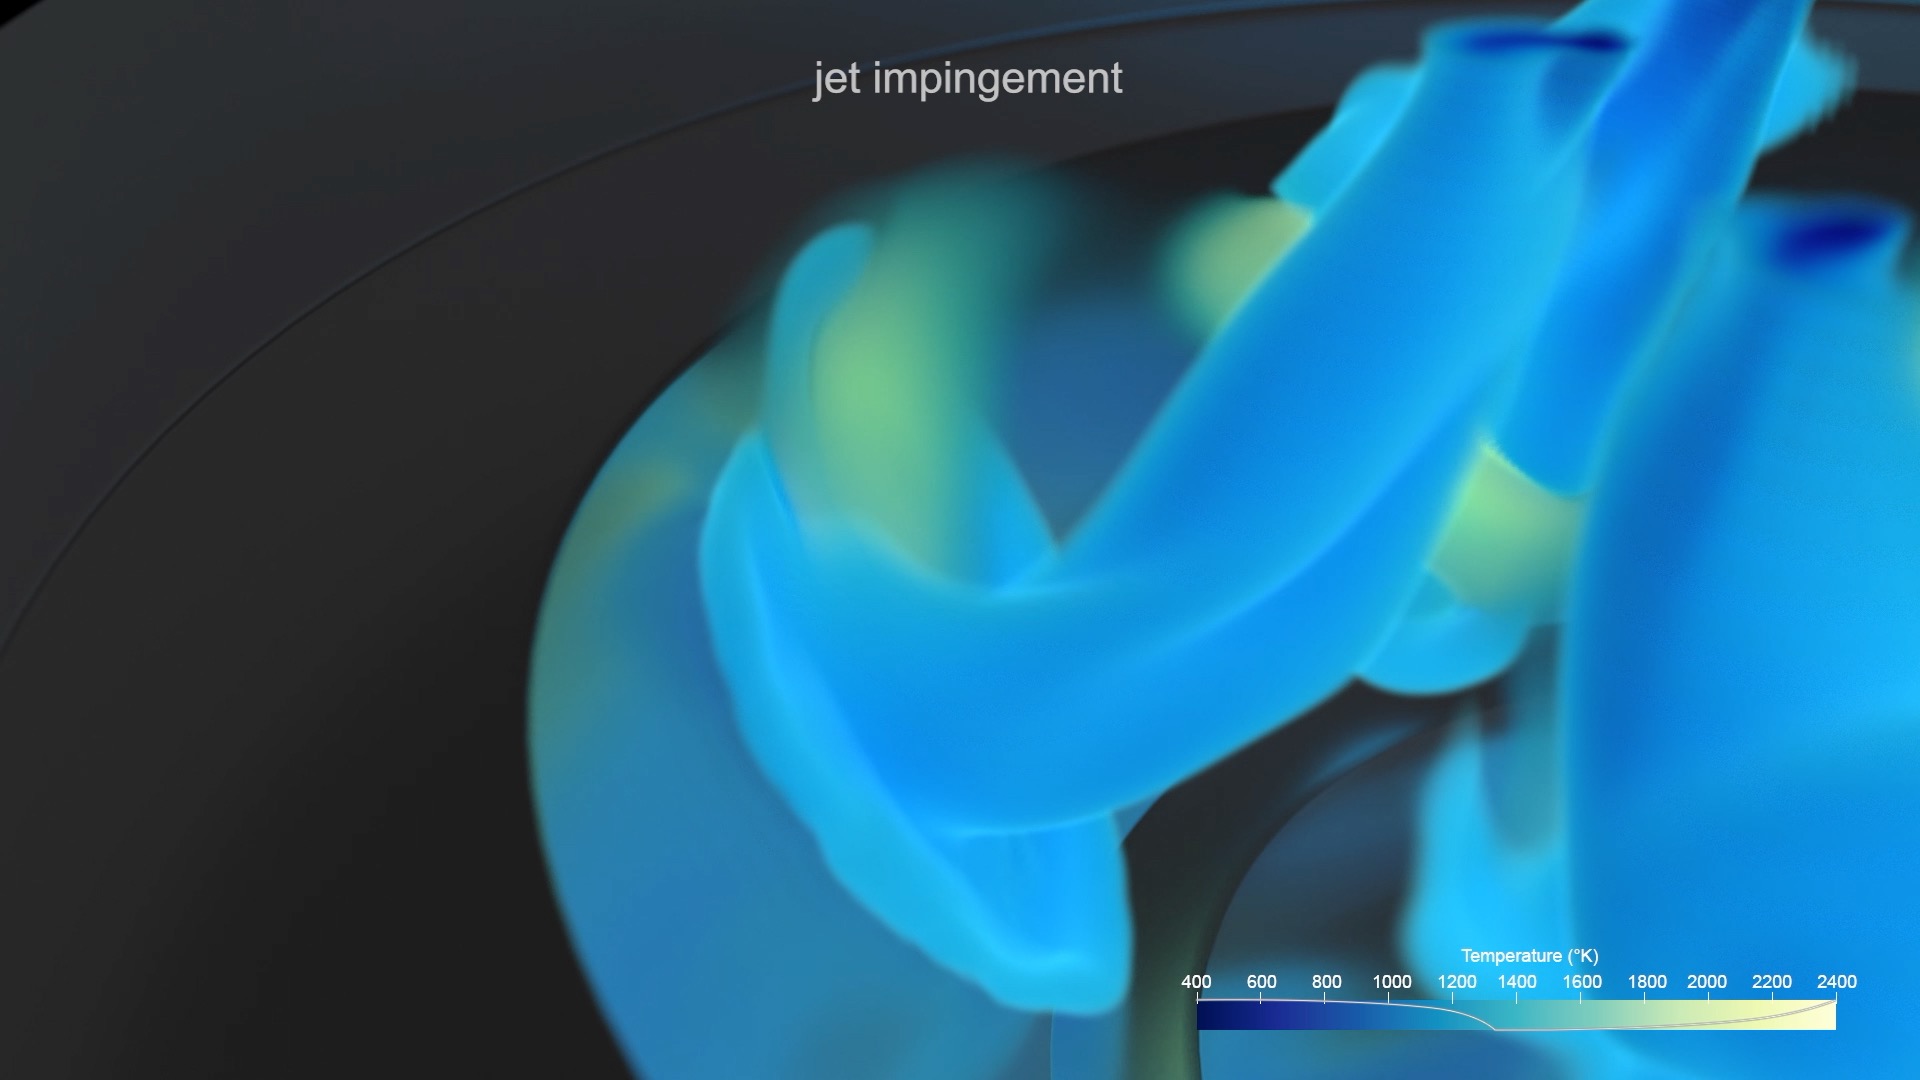
The transportation sector accounts for almost a third of the United States’ energy consumption. We are developing predictive simulations of the complex in-cylinder processes of internal combustion engines to improve performance and decrease pollutant emissions. We provide a first look at the jet impingement and ignition inside a piston-cylinder chamber using volume rendering. Through the visualization, constructed a complete 3D picture of the jet impingement on the piston-bowl walls leading to the formation of pockets of auto-ignition of the fuel-air mixture. These auto-ignition pockets subsequently lead to flame stabilization releasing the chemical energy for conversion to useful work. A detailed physical picture of flame stabilization, as provided by the visualization techniques presented in this study help, in the design of next-generation internal combustion engines.
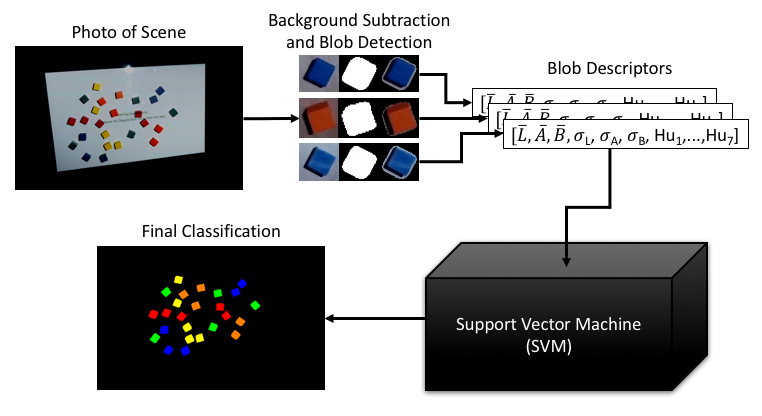
We describe a spatial augmented reality system with a tangible user interface used to control computer simulations of complex systems. In spatial augmented reality, the user’s physical space is augmented with projected imagery, blending real objects with projected information, and a tangible user interface enables users to manipulate physical objects as controllers for interactive visualizations. Our system learns ad hoc objects in the user’s environment as fiducial markers (i.e., objects that are visually recognized and tracked). When combined with simulation and visualization tools, these interfaces allow the user to control simulations or ensembles of simulations via physical objects using apt metaphors. While other research has leveraged the use of depth cameras, our system enables the use of standard cameras in readily available smartphones and webcams and has an implementation that runs completely in JavaScript in the web browser. We discuss the prerequisite object-recognition requirements for such tangible user interfaces and describe computer-vision and machine-learning algorithms meeting those requirements.
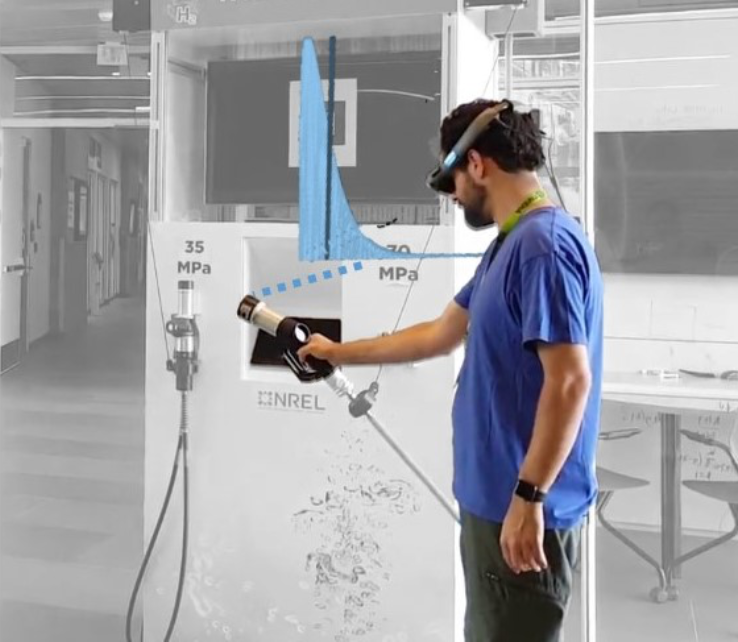
When delivering presentations to a co-located audience, we typically use slides with text and 2D graphics to complement the spoken narrative. Though presentations have largely been explored on 2D media, augmented reality (AR) allows presentation designers to add data and augmentations to existing physical infrastructure on display. This could provide a more engaging experience to the audience and support comprehension. With HydrogenAR, we present a novel application that leverages the benefits of data-driven storytelling with those of AR to explain the unique challenges of hydrogen dispenser reliability. Utilizing physical props, situated data, and virtual augmentations and animations, HydrogenAR serves as a unique presentation tool, particularly critical for stakeholders, tour groups, and VIPs. HydrogenAR is a product of multiple collaborative design iterations with a local Hydrogen Fuel research team and is evaluated through interviews with team members and a user study with end-users to evaluate the usability and quality of the interactive AR experience. Through this work, we provide design considerations for AR data-driven presentations and discuss how AR could be used for innovative content delivery beyond traditional slide-based presentations.
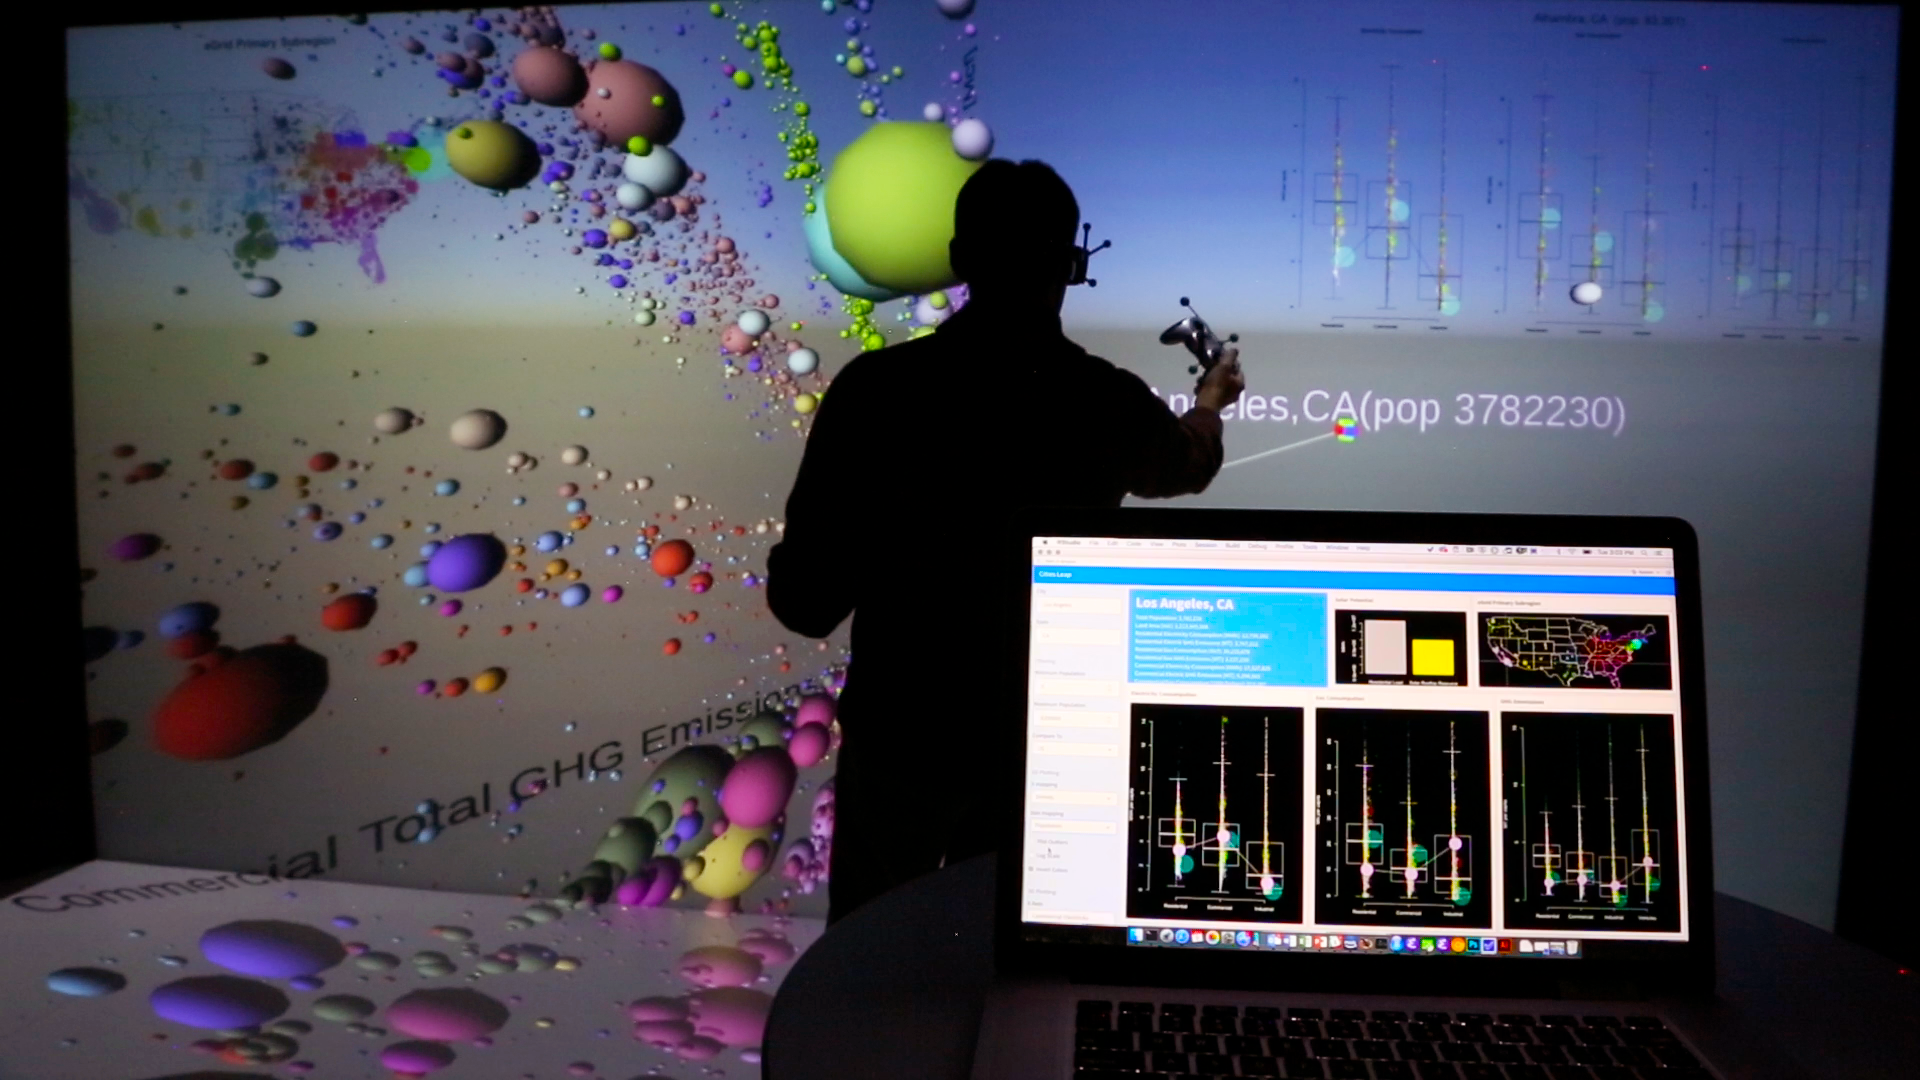
We discuss the value of collaborative, immersive visualization for the exploration of scientific datasets and review techniques and tools that have been developed and deployed at the National Renewable Energy Laboratory (NREL). We believe that collaborative visualizations that link statistical interfaces and graphics on laptops and high-performance computing (HPC), with 3D visualizations on immersive displays (head-mounted displays and large-scale immersive environments) enable scientific workflows that further rapid exploration of large, high-dimensional datasets by teams of analysts. We present a framework, PlottyVR, that blends statistical tools, general-purpose programming environments, and simulation with 3D visualizations. To contextualize this framework, we propose a categorization and loose taxonomy of collaborative visualization and analysis techniques. Finally, we describe how scientists and engineers have adopted this framework to investigate large, complex datasets.
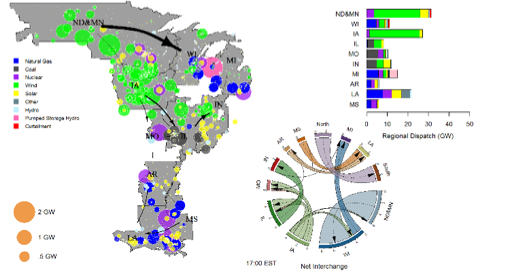
We describe the visualization approach for enhancing analyses of the ongoing Renewable Integration Impact (RIIA) Assessment by the Midcontinent Independent System Operator (MISO). It details the customization of state-of-the-art, open-source visualization code to complement existing power system visualization tools and data analytic processes used in MISO. This paper describes how this approach has provided additional insights for RIIA from multiple aspects with fine spatial-temporal granularity, including the comparison of different renewable integration scenarios, improved understanding of complex interactions, the effects of transmission upgrades, and the improved verification of MISO’s simulation results. We also made the updated visualization code package publicly available.
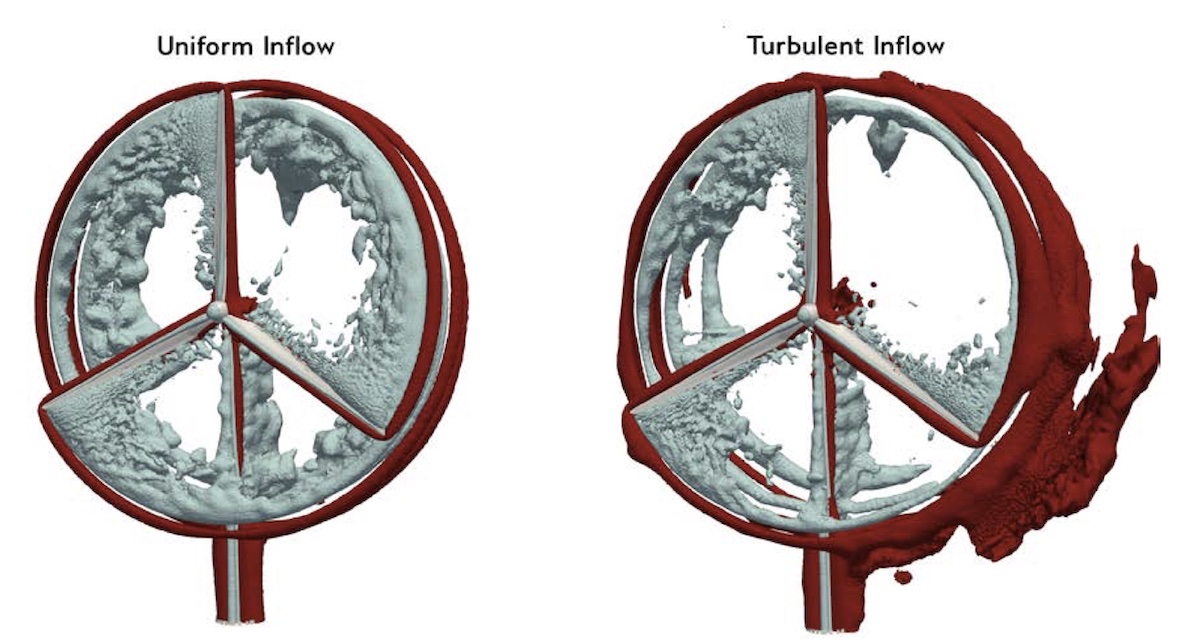
The goal of the ExaWind project is to enable predictive simulations of wind farms comprised of many megawatt- scale turbines situated in complex terrain. Predictive simulations will require computational fluid dynamics (CFD) simulations for which the mesh resolves the geometry of the turbines and captures the rotation and large deflec- tions of blades. Whereas such simulations for a single turbine are arguably petascale class, multi-turbine wind farm simulations will require exascale-class resources. We describe efforts to establish a body-resolved model of a megawatt-scale turbine that will be used for demonstrating and testing our wind farm simulation platform. The team chose the NREL 5-megawatt (MW) wind turbine, which is a notional turbine that is fully defined in the open domain. Given many proprietary issues surrounding modern turbines in the field (e.g., turbine control system, blade geometry and materials), a refer- ence turbine such as the NREL 5-MW is ideal for the benchmarking and demonstration studies that will be key to the success of the ExaWind project. This milestone was designed to demonstrate a working model that will be used for figure-of-merit measurements and will establish baseline results that will be improved upon as the project progresses.
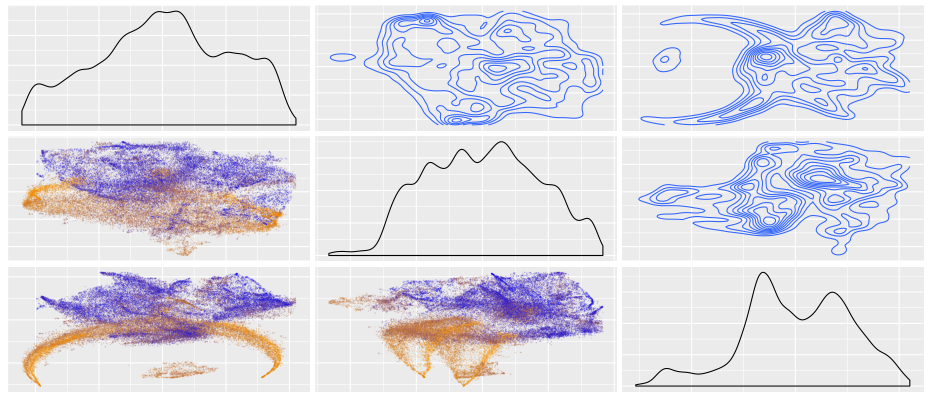
Complex ensembles of energy simulation models have become significant components of renewable energy research in recent years. Often the significant computational cost, high‐dimensional structure, and other complexities hinder researchers from fully utilizing these data sources for knowledge building. Researchers at National Renewable Energy Laboratory have developed an immersive visualization workflow to dramatically improve user engagement and analysis capability through a combination of low‐dimensional structure analysis, deep learning, and custom visualization methods. We present case studies for two energy simulation platforms.
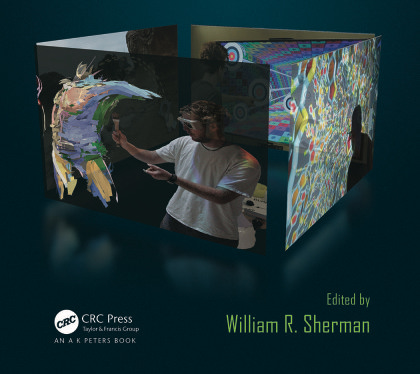
In our daily usage of the large-scale immersive virtual environment at the National Renewable Energy Laboratory (NREL), we have observed how this VR system can be a useful tool to enhance scientific and engineering workflows. On multiple occasions, we have observed scientists and engineers discover features in their data using immersive environments that they had not seen in prior investigations of their data on traditional desktop displays. We have embedded more information into our analytics tools, allowing engineers to explore complex multivariate spaces. We have observed natural interactions with 3D objects and how those interactions seem to catalyze understanding. And we have seen improved collaboration with groups of stakeholders. In this chapter, we discuss these practical advantages of immersive visualization in the context of several real-world examples.
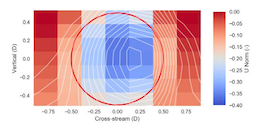
In this paper, data from a lidar-based field campaign are used to examine the effect of yaw misalignment on the shape of a wind turbine wake. Prior investigation in wind tunnel research and high-fidelity computer simulation show that the shape assumes an increasingly curled shape as the wake propagates downstream, because of the presence of two counter-rotating vortices. The shape of the wake observed in the field data diverges from predictions of wake shape, and a lidar model is simulated within a large-eddy simulation of the wind turbine in the atmospheric boundary layer to understand the discrepancy.
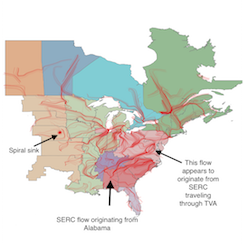
We describe a method for visualizing data flows on large networks. We transform data flow on fixed networks into a vector field, which can be directly visualized using scientific flow visualization techniques. We evaluated the method on power flowing through two transmission power networks: a small, regional, IEEE test system (RTS-96) and a large national-scale system (the Eastern Interconnection). For the larger and more complex transmission system, the method illustrates features of the power flow that are not accessible when visualizing the power transmission with traditional network visualization techniques.
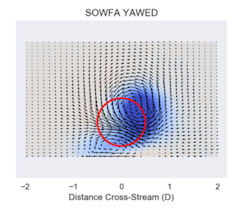
In this paper, we investigate the role of flow structures generated in wind farm control through yaw misalignment. A pair of counter-rotating vortices are shown to be important in deforming the shape of the wake and in explaining the asymmetry of wake steering in oppositely signed yaw angles. We motivate the development of new physics for control-oriented engineering models of wind farm control, which include the effects of these large-scale flow structures. Such a new model would improve the predictability of control-oriented models. Results presented in this paper indicate that wind farm control strategies, based on new control-oriented models with new physics, that target total flow control over wake redirection may be different, and perhaps more effective, than current approaches. We propose that wind farm control and wake steering should be thought of as the generation of large-scale flow structures, which will aid in the improved performance of wind farms.
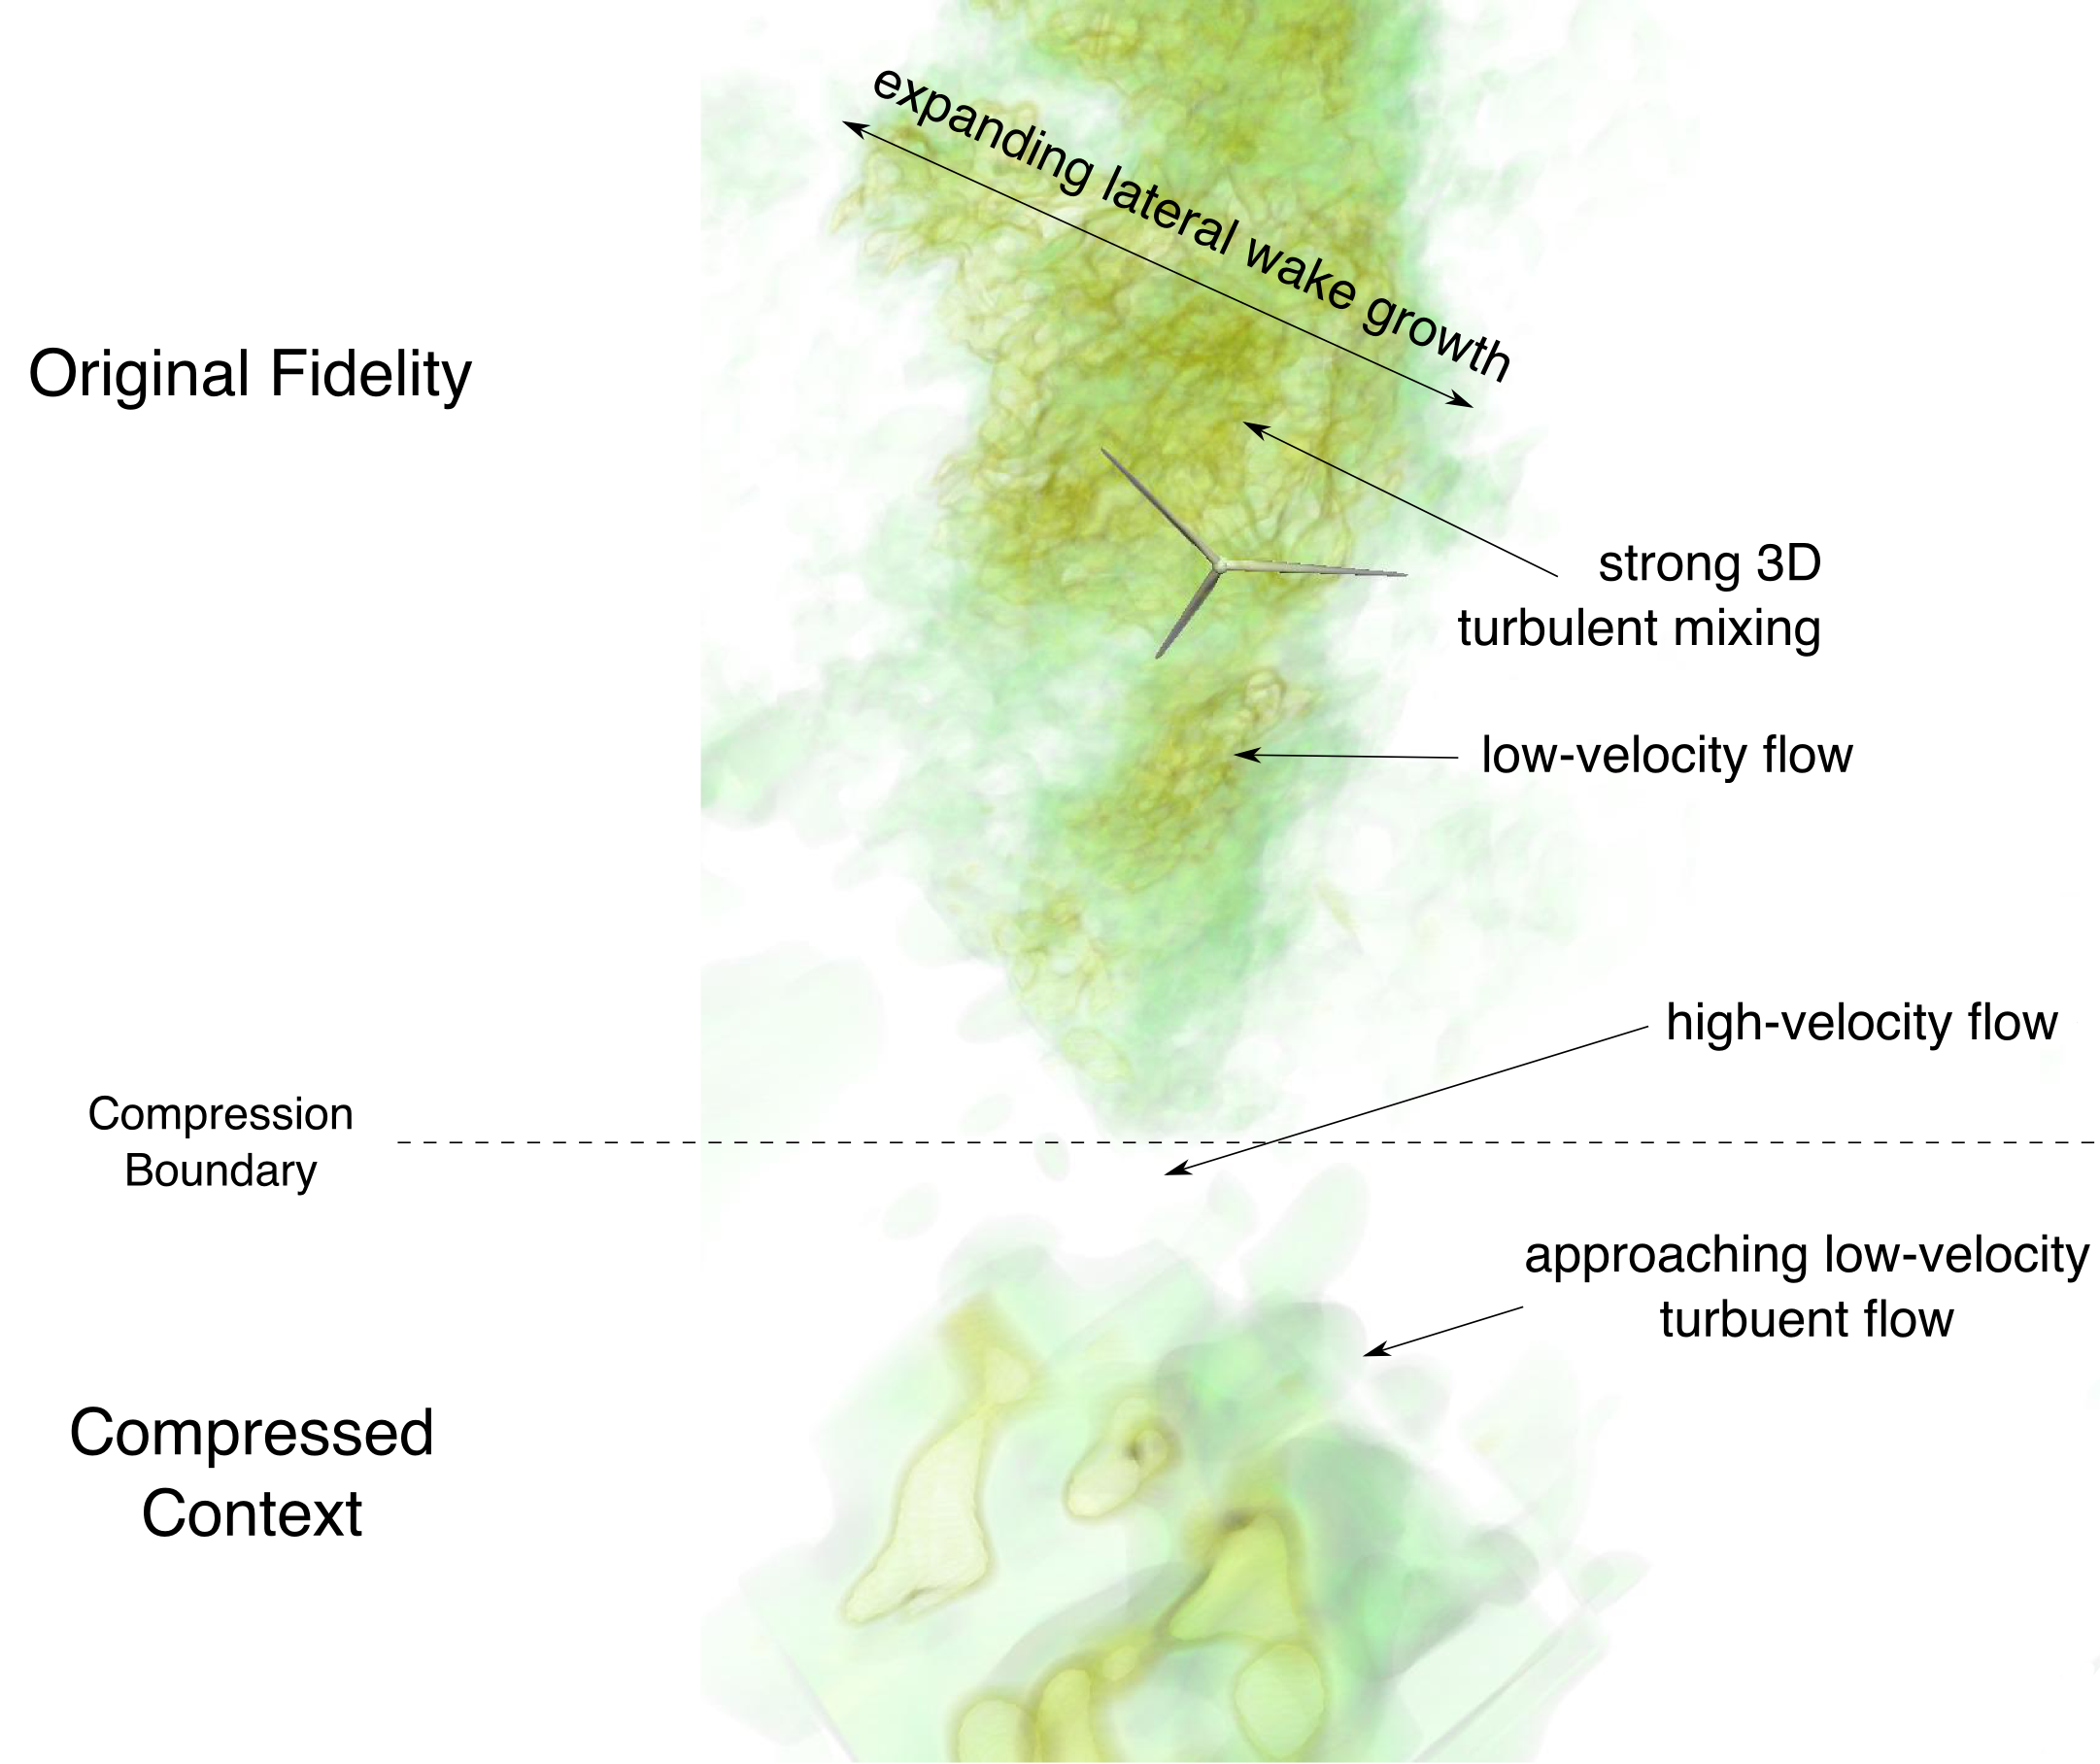
Data sizes are becoming a critical issue particularly for HPC applications. We have developed a user-driven lossy wavelet-based storage model to facilitate the analysis and visualization of large-scale wind turbine array simulations. The model stores data as heterogeneous blocks of wavelet coefficients, providing high-fidelity access to user-defined data regions believed the most salient, while providing lower-fidelity access to less salient regions on a block-by-block basis. In practice, by retaining the wavelet coefficients as a function of feature saliency, we have seen data reductions in excess of 94%, while retaining lossless information in the turbine-wake regions most critical to analysis and providing enough (low-fidelity) contextual information in the upper atmosphere to track incoming coherent turbulent structures. Our contextual wavelet compression approach has allowed us to deliver interactive visual anlaysis while providing the user control over where data loss, and thus reduction in accuracy, in the analysis occurs. We argue this reduced but contexualized representation is a valid approach and encourages contextual data management.
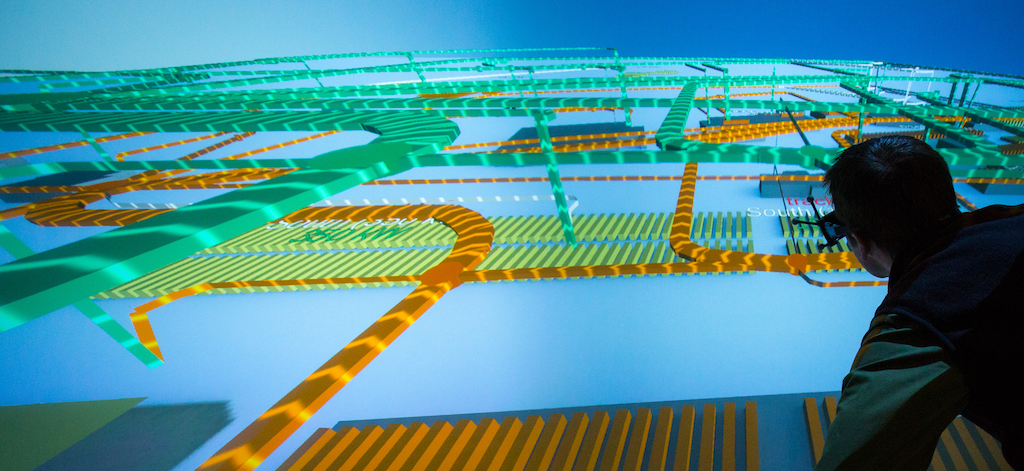
We have developed a framework for the exploration, design, and planning of energy systems that combines interactive visualization with machine-learning based approximations of simulations through a general purpose dataflow API. Our system provides a visual interface allowing users to explore an ensemble of energy simulations representing a subset of the complex input parameter space, and spawn new simulations to “fill in” input regions corresponding to new energy system scenarios. Unfortunately, many energy simulations are far too slow to provide interactive responses. To support interactive feedback, we are developing reduced-form models via machine learning techniques, which provide statistically sound estimates of the full simulations at a fraction of the computational cost and which are used as proxies for the full-form models. Fast computation and an agile dataflow enhance the engagement with energy simulations, and allows researchers to better allocate computational resources to capture informative relationships within the system and provide a low-cost method for validating and quality-checking large-scale modeling efforts.
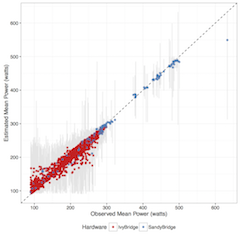
Power use in data centers and high-performance computing (HPC) facilities has grown in tandem with increases in the size and number of these facilities. Substantial innovation is needed to enable meaningful reduction in energy footprints in leadership-class HPC systems. In this paper, we focus on characterizing and investigating application-level power usage. We demonstrate potential methods for predicting power usage based on a priori and in situ characteristics. Finally, we highlight a potential use case of this method through a simulated power-aware scheduler using historical jobs from a real scientific HPC system.

Supported metal catalysts are commonly used for the hydrogenation and deoxygenation of biomass-derived aromatic compounds in catalytic fast pyrolysis. To date, the substrate–adsorbate interactions under reaction conditions crucial to these processes remain poorly understood, yet understanding this is critical to constructing detailed mechanistic models of the reactions important to catalytic fast pyrolysis. Density functional theory (DFT) has been used in identifying mechanistic details, but many of these works assume surface models that are not representative of realistic conditions, for example, under which the surface is covered with some concentration of hydrogen and aromatic compounds. In this study, we investigate hydrogen-guaiacol coadsorption on Pt(111) using van der Waals-corrected DFT and ab initio thermodynamics over a range of temperatures and pressures relevant to bio-oil upgrading. We find that relative coverage of hydrogen and guaiacol is strongly dependent on the temperature and pressure of the system. Under conditions relevant to ex situ catalytic fast pyrolysis (CFP; 620–730 K, 1–10 bar), guaiacol and hydrogen chemisorb to the surface with a submonolayer hydrogen (∼0.44 ML H), while under conditions relevant to hydrotreating (470–580 K, 10–200 bar), the surface exhibits a full-monolayer hydrogen coverage with guaiacol physisorbed to the surface. These results correlate with experimentally observed selectivities, which show ring saturation to methoxycyclohexanol at hydrotreating conditions and deoxygenation to phenol at CFP-relevant conditions. Additionally, the vibrational energy of the adsorbates on the surface significantly contributes to surface energy at higher coverage. Ignoring this contribution results in not only quantitatively, but also qualitatively incorrect interpretation of coadsorption, shifting the phase boundaries by more than 200 K and ∼10–20 bar and predicting no guaiacol adsorption under CFP and hydrotreating conditions. The implications of this work are discussed in the context of modeling hydrogenation and deoxygenation reactions on Pt(111), and we find that only the models representative of equilibrium surface coverage can capture the hydrogenation kinetics correctly. Last, as a major outcome of this work, we introduce a freely available web-based tool, dubbed the Surface Phase Explorer (SPE), which allows researchers to conveniently determine surface composition for any one- or two-component system at thermodynamic equilibrium over a wide range of temperatures and pressures on any crystalline surface using standard DFT output.
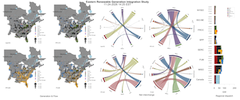
The Eastern Renewable Generation Integration Study (ERGIS), explores the operational impacts of the widespread adoption of wind and solar photovoltaic (PV) resources in the U.S. Eastern Interconnection and Que ́bec Interconnection (collectively, EI). In order to understand some of the economic and reliability challenges of managing hundreds of gigawatts of wind and PV generation, we developed state of the art tools, data, and models for simulating power system operations using hourly unit commitment and 5-minute economic dispatch over an entire year. Using NRELs high performance computing capabilities and new methodologies to model operations, we found that the EI could balance the variability and uncertainty of high penetrations of wind and PV at a 5-minute level under a variety of conditions. A large-scale display and a combination of multiple coordinated views and small multiples were used to visually analyze the four large highly multivariate scenarios with high spatial and temporal resolutions.
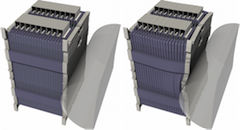
Lithium-ion batteries are currently the state-of-the-art power sources for electric vehicles, and their safety behavior when subjected to abuse, such as a mechanical impact, is of critical concern. A coupled mechanical-electrical-thermal model for simulating the behavior of a lithium-ion battery under a mechanical crush has been developed. We present a series of production-quality visualizations to illustrate the complex mechanical and electrical interactions in this model.
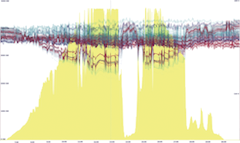
Duke Energy, Alstom Grid (now GE Grid Solutions), and the National Renewable Energy Laboratory (NREL) collaborated to better understand advanced inverter and distribution management system (DMS) control options for large (1–5 MW) distributed solar photovoltaics (PV) and their impacts on distribution system operations. The specific goal of the project was to compare the operational—specifically, voltage regulation—impacts of three methods of managing voltage variations resulting from such PV systems: active power, local autonomous inverter control, and integrated volt/VAR control. The project found that all tested configurations of DMS-controlled IVVC provided improved performance and provided operational cost savings compared to the baseline and local control modes. Specifically, IVVC combined with PV at a 0.95 PF proved the technically most effective voltage management scheme for the system studied. This configuration substantially reduced both utility regulation equipment operations and observed voltage challenges.
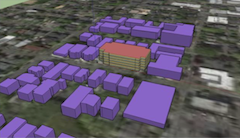
Assessing the impact of energy efficiency technologies at a city scale is of great interest to city planners, utility companies, and policy makers. This paper describes a flexible framework which can be used to create and run city scale building energy simulations. The framework is built around the new OpenStudio City Database (CityDB). Building footprints, building height, building type, and other data can be imported into the database from public records or other sources. The OpenStudio City User Interface (CityUI) can be used to inspect and edit data in the CityDB. Unknown data can be inferred or assigned from a statistical sampling of other datasets such as the Commercial Buildings Energy Consumption Survey (CBECS) or Residential Energy Consumption Survey (RECS). Once all required data is available, OpenStudio measures are used to create starting point energy models for each building in the dataset and to model particular energy efficiency measures for each building. Together this framework allows a user to pose several scenarios such as “what if 30% of the commercial retail buildings added roof top solar” or “what if all elementary schools converted to ground source heat pumps” and then visualize the impacts at a city scale. This paper focuses on modeling existing building stock using public records; however, the framework is capable of supporting the evaluation of new construction and the use of proprietary data sources.
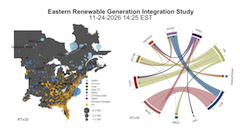
The U.S. Department of Energy commissioned the National Renewable Energy Laboratory (NREL) to answer a question: What conditions might system operators face if the Eastern Interconnection (EI), a system designed to operate reliably with fossil fueled, nuclear, and hydro generation, was transformed to one that relied on wind and solar photovoltaics (PV) to meet 30% of annual electricity demand? In this resulting study—Eastern Renewable Generation Integration Study (ERGIS)— NREL answers that question and, in doing so, gives insights on likely operational impacts of higher percentages—up to 30% on an annual energy basis with instantaneous penetrations over 50%—of combined wind and PV generation in the EI. We evaluate potential power system futures where significant portions of the existing generation fleet are retired and replaced by different portfolios of transmission, wind, PV, and natural gas generation. We explore how variable and uncertain conditions caused by wind and solar forecast errors, seasonal and diurnal patterns, weather and system operating constraints impact certain aspects of reliability and economic efficiency. Specifically, we model how the system could meet electricity demand at a 5-minute time interval by scheduling resources for known ramping events, while maintaining adequate reserves to meet random variation in supply and demand, and contingency events.

We present a visualization-driven simulation system that tightly couples systems dynamics simulations with an immersive virtual environment to allow analysts to rapidly develop and test hypotheses in a high-dimensional parameter space. To accomplish this, we generalize the two-dimensional parallel-coordinates statistical graphic as an immersive “parallel-planes” visualization for multivariate time series emitted by simulations running in parallel with the visualization. In contrast to traditional parallel coordinate’s mapping the multivariate dimensions onto coordinate axes represented by a series of parallel lines, we map pairs of the multivariate dimensions onto a series of parallel rectangles. As in the case of parallel coordinates, each individual observation in the dataset is mapped to a polyline whose vertices coincide with its coordinate values. Regions of the rectangles can be “brushed” to highlight and select observations of interest: a “slider” control allows the user to filter the observations by their time coordinate. In an immersive virtual environment, users interact with the parallel planes using a joystick that can select regions on the planes, manipulate selection, and filter time. The brushing and selection actions are used to both explore existing data as well as to launch additional simulations corresponding to the visually selected portions of the input parameter space. As soon as the new simulations complete, their resulting observations are displayed in the virtual environment. This tight feedback loop between simulation and immersive analytics accelerates users’ realization of insights about the simulation and its output.
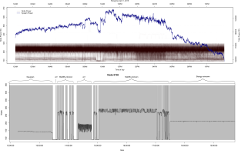
As the capacity of high performance computing (HPC) systems continues to grow, small changes in energy management have the potential to produce significant energy savings. In this paper, we employ an extensive informatics system for aggregating and analyzing real-time performance and power use data to evaluate energy footprints of jobs running in an HPC data center. We look at the effects of algorithmic choices for a given job on the resulting energy footprints, and analyze application-specific power consumption, and summarize average power use in the aggregate. All of these views reveal meaningful power variance between classes of applications as well as chosen methods for a given job. Using these data, we discuss energy-aware cost-saving strategies based on reordering the HPC job schedule. Using historical job and power data, we present a hypothetical job schedule reordering that: (1) reduces the facility’s peak power draw and (2) manages power in conjunction with a large-scale photovoltaic array. Lastly, we leverage this data to understand the practical limits on predicting key power use metrics at the time of submission.

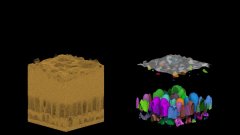
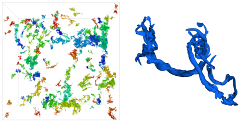
Substrate accessibility to catalysts has been a dominant theme in theories of biomass deconstruction. However, current methods of quantifying accessibility do not elucidate mechanisms for increased accessibility due to changes in microstructure following pretreatment. We introduce methods for characterization of surface accessibility based on fine-scale microstructure of the plant cell wall as revealed by 3D electron tomography. These methods comprise a general framework, enabling analysis of image-based cell wall architecture using a flexible model of accessibility. We analyze corn stover cell walls, both native and after undergoing dilute acid pretreatment with and without a steam explosion process, as well as AFEX pretreatment. Image-based measures provide useful information about how much pretreatments are able to increase biomass surface accessibility to a wide range of catalyst sizes. We find a strong dependence on probe size when measuring surface accessibility, with a substantial decrease in biomass surface accessibility to probe sizes above 5 nm radius compared to smaller probes.
I/O is increasingly becoming a significant constraint for simulation codes and visualization tools on modern supercomputers. Data compression is an attractive workaround, and, in particular, wavelets provide a promising solution. However, wavelets can be applied in multiple configurations, and the variations in configuration impact accuracy, storage cost, and execution time. While the variation in these factors over wavelet configurations have been explored in image processing, they are not well understood for visualization and analysis of scientific data. To illuminate this issue, we evaluate multiple wavelet configurations on turbulent-flow data. Our approach is to repeat established analysis routines on uncompressed and lossy-compressed versions of a data set, and then quantitatively compare their outcomes. Our findings show that accuracy varies greatly based on wavelet configuration, while storage cost and execution time vary less. Overall, our study provides new insights for simulation analysts and visualization experts, who need to make tradeoffs between accuracy, storage cost, and execution time.
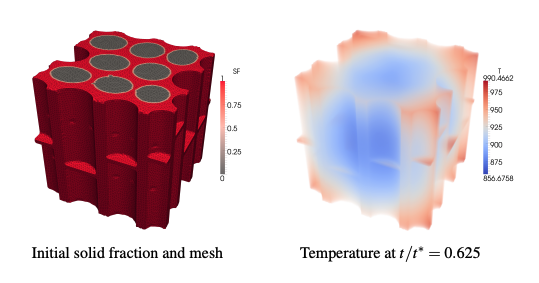
The coupled heat transfer and chemical kinetics processes inside of a pyrolyzing biomass particle are simulated with realistic intra-particle geometry to investigate the effects of the cellular structure on char yields. Although the technology exists for deriving liquid fuels from biomass via pyrolysis oil, it is not currently cost-effective relative to competing fuel streams. DOE EERE’s multi-year program plan articulates a goal to bring the estimated mature technology cost to produce gasoline and diesel blendstocks via thermochemical pathways down to $1.56 per gallon of total blendstock by 2017; decreasing the char residual during primary pyrolysis is a key improvement necessary to meet that goal. It is generally agreed that the residual char fraction is strongly dependent on the biomass heating rate; what is not well understood is the role of the biomass cellular structure on the localized heating rates and kinetics within a biomass particle. An unstructured finite-element analysis tool (DKSOLVE) is built upon FEniCS—an open source collection of tools for automating the solution of differential equations — to treat the diffusive transport and Cantera handle the pyrolysis reactions. Whereas previous attempts to account for intra-particle variation have considered only relatively simplistic geometries (e.g., radially symmetric cylinders and spheres) with low dimensional techniques, here full three-dimensional unstructured meshes are used to treat realistic geometries. Canonical geometries are created that typify key characteristics observed from experimental measurements. In this initial study, a lumped chemistry model for the primary pyrolysis kinetics is used to first validate the new code and computational techniques through comparison to earlier works considering spherical particles, followed by application to the complex geometry cases. It is found that the variations in heat transfer coefficients between the cell walls and lumen can lead to locally enhanced/degraded heating rates relative to a uniform particle and a corresponding non-uniformity in the residual composition. The foundation is formed for further work to examine the effects of secondary reactions occurring in pyrolysis gasses before they escape the biomass particle and to search for geometric modifications that improve yields and are achievable through practical pretreatments.
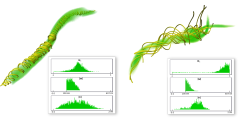
We introduce an iterative feature-based transfer function design that extracts and systematically incorporates multivariate feature-local statistics into a texture-based volume rendering process. We argue that an interactive multivariate feature-local approach is advantageous when investigating ill-defined features, because it provides a physically meaningful, quantitatively rich environment within which to examine the sensitivity of the structure properties to the identification parameters. We demonstrate the efficacy of this approach by applying it to vortical structures in Taylor-Green turbulence. Our approach identified the existence of two distinct structure populations in these data, which cannot be isolated or distinguished via traditional transfer functions based on global distributions.
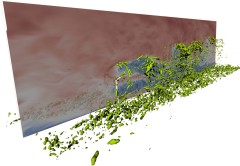
As the US moves toward 20% wind power by 2030, computational modeling will play an increasingly important role in determining wind-plant siting, designing more efficient and reliable wind turbines, and understanding the interaction between large wind plants and regional weather. From a computing perspective, however, adequately resolving the relevant scales of wind-energy production is a petascale problem verging on exascale. In this paper we discuss the challenges associated with computational simulation of the multiscale wind-plant system, which includes turbine-scale turbulence, atmospheric-boundary-layer turbulence, and regional-weather variation. An overview of computational modeling approaches is presented, and our particular modeling strategy is described, which involves modification and coupling of three open-source codes—FAST, OpenFOAM, and WRF, for structure aeroelasticity, local fluid dynamics, and mesoscale fluid dynamics, respectively.
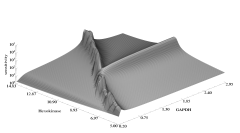
The High-Performance Systems Biology Toolkit (HiPer SBTK) is a collection of simulation and optimization components for metabolic modeling and the means to assemble them into large parallel processing hierarchies suiting a particular simulation optimization need. The components come in a variety of different categories: model translation, model simulation, parameter sampling, sensitivity analysis, parameter estimation, and optimization. They can be configured at runtime into hierarchically parallel arrangements to perform nested combinations of simulation characterization tasks with excellent parallel scaling to thousands of processors. We describe the observations that led to the system, the components, and how one can arrange them. We show nearly 90% efficient scaling to over 13,000 processors, and we demonstrate three complex yet typical examples that have run on ∼1000 processors and accomplished billions of stiff ordinary differential equation simulations.
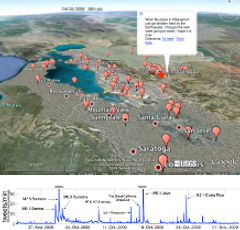
People in the locality of earthquakes are publishing anecdotal information about the shaking within seconds of their occurrences via social network technologies, such as Twitter. In contrast, depending on the size and location of the earthquake, scientific alerts can take between two to twenty minutes to publish. We describe TED (Twitter Earthquake Detector) a system that adopts social network technologies to augment earthquake response products and the delivery of hazard information. The TED system analyzes data from these social networks for multiple purposes: 1) to integrate citizen reports of earthquakes with corresponding scientific reports 2) to infer the public level of interest in an earthquake for tailoring outputs disseminated via social network technologies and 3) to explore the possibility of rapid detection of a probable earthquake, within seconds of its occurrence, helping to fill the gap between the earthquake origin time and the presence of quantitative scientific data.
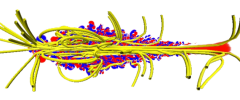
In this paper we discuss recent developments in the capabilities of VAPOR (open source, available at http://www.vapor.ucar.edu): a desktop application that leverages today’s powerful CPUs and GPUs to enable visualization and analysis of terascale data sets using only a commodity PC or laptop. We review VAPORs current capabilities, highlighting support for Adaptive Mesh Refinement (AMR) grids, and present new developments in interactive feature-based visualization and statistical analysis.
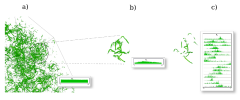
One of the barriers to visualization-enabled scientific discovery is the difficulty in clearly and quantitatively articulating the meaning of a visualization, particularly in the exploration of relationships between multiple variables in large-scale data sets. This issue becomes more complicated in the visualization of three-dimensional turbulence, since geometry, topology, and statistics play complicated, intertwined roles in the definitions of the features of interest, making them difficult or impossible to precisely describe. This dissertation develops and evaluates a novel interactive multivariate volume visualization framework that allows features to be progressively isolated and defined using a combination of global and feature-local properties. I argue that a progressive and interactive multivariate feature-local approach is advantageous when investigating ill-defined features because it provides a physically meaningful, quantitatively rich environment within which to examine the sensitivity of the structure properties to the identification parameters. The efficacy of this approach is demonstrated in the analysis of vortical structures in Taylor-Green turbulence. Through this analysis, two distinct structure populations have been discovered in these data: structures with minimal and maximal local absolute helicity distributions. These populations cannot be distinguished via global distributions; however, they were readily identified by this approach, since their feature-local statistics are distinctive.
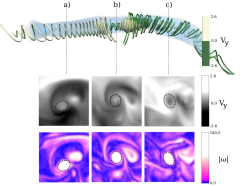
Knowledge extraction from data volumes of ever increasing size requires ever more flexible tools to facilitate interactive query. Interactivity enables real-time hypothesis testing and scientific discovery, but can generally not be achieved without some level of data reduction. The approach described in this paper combines multi-resolution access, region-of-interest extraction, and structure identification in order to provide interactive spatial and statistical analysis of a terascale data volume. Unique aspects of our approach include the incorporation of both local and global statistics of the flow structures, and iterative refinement facilities, which combine geometry, topology, and statistics to allow the user to effectively tailor the analysis and visualization to the science. Working together, these facilities allow a user to focus the spatial scale and domain of the analysis and perform an appropriately tailored multivariate visualization of the corresponding data. All of these ideas and algorithms are instantiated in a deployed visualization and analysis tool called VAPOR, which is in routine use by scientists internationally. In data from a 1024x1024x1024 simulation of a forced turbulent flow, VAPOR allowed us to perform a visual data exploration of the flow properties at interactive speeds, leading to the discovery of novel scientific properties of the flow. This kind of intelligent, focused analysis/refinement approach will become even more important as computational science moves towards petascale applications.

We studied the added value in using immersive visualization as a molecular research tool. We present our results in the context of “embodied cognition”, as a way to understand situations in which immersive virtual visualization may be particularly useful. PYMOL, a non-immersive application used by biochemistry researchers, was ported to an immersive virtual environment (IVE) to run on a four-PC cluster. Three research groups were invited to extend their current research on a molecule of interest to include an investigation of that molecule inside the IVE. The groups each had a similar experience of visualizing a feature of their molecule they had not previously appreciated from workstation viewing; large-scale spatial features, such as pockets and ridges, were readily identified when walking around the molecule displayed at human scale. We suggest that this added value arises because an IVE affords the opportunity to visualize the molecule using normal, everyday-world perceptual abilities that have been tuned and practiced from birth. This work also suggests that short sessions of IVE viewing can valuably augment extensive, non-IVE based visualizations.
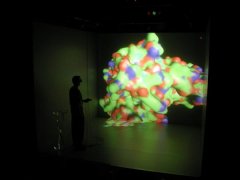
Immersive virtual environments are becoming increasingly common, driving the need to develop new software or adapt existing software to these environments. We discuss some of the issues and limitations of porting an existing molecular graphics system, PyMOL, into an immersive virtual environment. Presenting macromolecules inside an interactive immersive virtual environment may provide unique insights into molecular structure and improve the rational design of drugs that target a specific molecule. PyMOL was successfully extended to render molecular structures immersively; however, elements of the legacy interactive design did not scale well into three-dimensions. Achieving an interactive frame rate for large macromolecules was also an issue. The immersive system was developed and evaluated on both a shared-memory parallel machine and a commodity cluster.
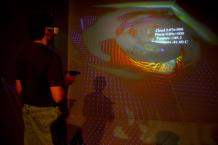
In this paper, we describe an immersive prototype application, AtmosV, developed to interactively visualize the large multivariate atmospheric dataset provided by the IEEE Visualization 2004 Contest committee. The visualization approach is a combination of volume and polygonal rendering. The immersive application was developed and evaluated on both a shared-memory parallel machine and a commodity cluster. Using the cluster we were able to visualize multiple variables at interactive frame rates.
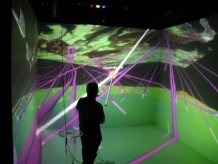
The benefits of immersive visualization are primarily anecdotal; there have been few controlled user studies that have attempted to quantify the added value of immersion for problems requiring the manipulation of virtual objects. This research quantifies the added value of immersion for a real-world industrial problem: oil well-path planning. An experiment was designed to compare human performance between an immersive virtual environment (IVE) and a desktop workstation. This work presents the results of sixteen participants who planned the paths of four oil wells. Each participant planned two well-paths on a desktop workstation with a stereoscopic display and two well-paths in a CAVE-like IVE. Fifteen of the participants completed well-path editing tasks faster in the IVE than in the desktop environment. The increased speed was complimented by a statistically significant increase in correct solutions in the IVE. The results suggest that an IVE can allow for faster and more accurate problem solving in a complex three-dimensional domain.
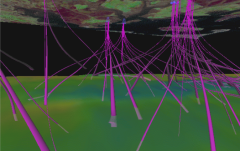
The benefits of immersive visualization are primarily anecdotal; there have been few controlled users studies that have attempted to quantify the added value of immersion for problems requiring the manipulation of virtual objects. This research quantifies the added value of immersion for a real-world industrial problem: oil well path planning. An experiment was designed to compare human performance between an immersive virtual environment (IVE) and a desktop workstation with stereoscopic display. This work consisted of building a cross-environment application, capable of visualizing and editing a planned well path within an existing oilfield, and conducting an user study on that application. This work presents the results of sixteen participants who planned the paths of four oil wells. Each participant planned two well paths on a desktop workstation with a stereoscopic display and two well paths in a CAVE-like IVE. Fifteen of the participants completed well path editing tasks faster in the IVE than in the desktop environment, which is statistically significant (p < 0.001). The increased speed in the IVE was complimented by an increase correct solutions. There was a statistically significant (p < 0.05) increase in correct solutions in the IVE. The results suggest that an IVE allows for faster and more accurate problem solving in a complex interactive three-dimensional domain.
Selected Video
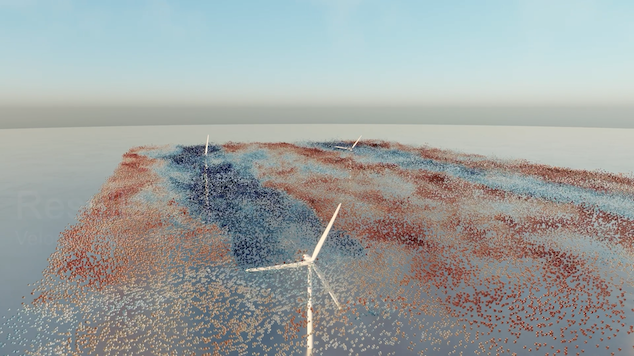
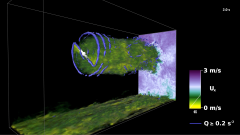
This video examines the flow dynamics in a four-turbine wind farm. The data presented is from a large-scale geometry-resolved simulation of four five-megawatt wind turbines. These simulations were conducted with the ExaWind software stack. ExaWind integrates two computational-fluid-dynamics (CFD) solvers through an overset-mesh method: AMR-Wind, a structured-grid, adaptive-mesh-refinement CFD solver, solves the large-scale atmospheric boundary layer background flow, and Nalu-Wind, an unstructured-grid CFD solver, solves the flow around the wind turbine blades and tower. TIOGA is used for overset grid connectivity and solution communication at mesh overlaps. OpenFAST solves the nonlinear structural dynamics of the turbine blades and towers and provides forces and displacements for structural response that informs the fluid-structure interaction. The simulation visualized in this video includes four blade-resolved wind turbines operating in a turbulent atmospheric boundary layer. There are 500 million cells in the AMR-Wind solver, which is using 256 AMD GPUs of the Oakridge Leadership Computing Facility Frontier supercomputer. One Nalu-Wind solver instance is assigned to each wind turbine. Each turbine is discretized with over 13 million elements and solved using 448 CPU cores, for a total of 1792 CPU cores running four Nalu-Wind solvers. The cores on each Frontier node are allocated as 56 cores for Nalu-Wind and 8 cores for AMR-Wind operations on the GPUs. The ExaWind simulation is therefore using all available CPUs and GPUs concurrently. The visualization data results from the full flow field data of the simulation. To enable real-time flow visualization, the data is written to disk every 16 time-steps and lossy-compressed to a specific accuracy using ZFP. Custom tooling was developed to translate the compressed AMR-Wind data to a multi-resolution voxel grid and Nalu-Wind artifacts to blade and tower geometry. Blender is used to render the visualization, with the iso-contours and particle advection being performed with Blender’s geometry node feature. NREL’s Insight Center visualization cluster was used to compute the resulting content.
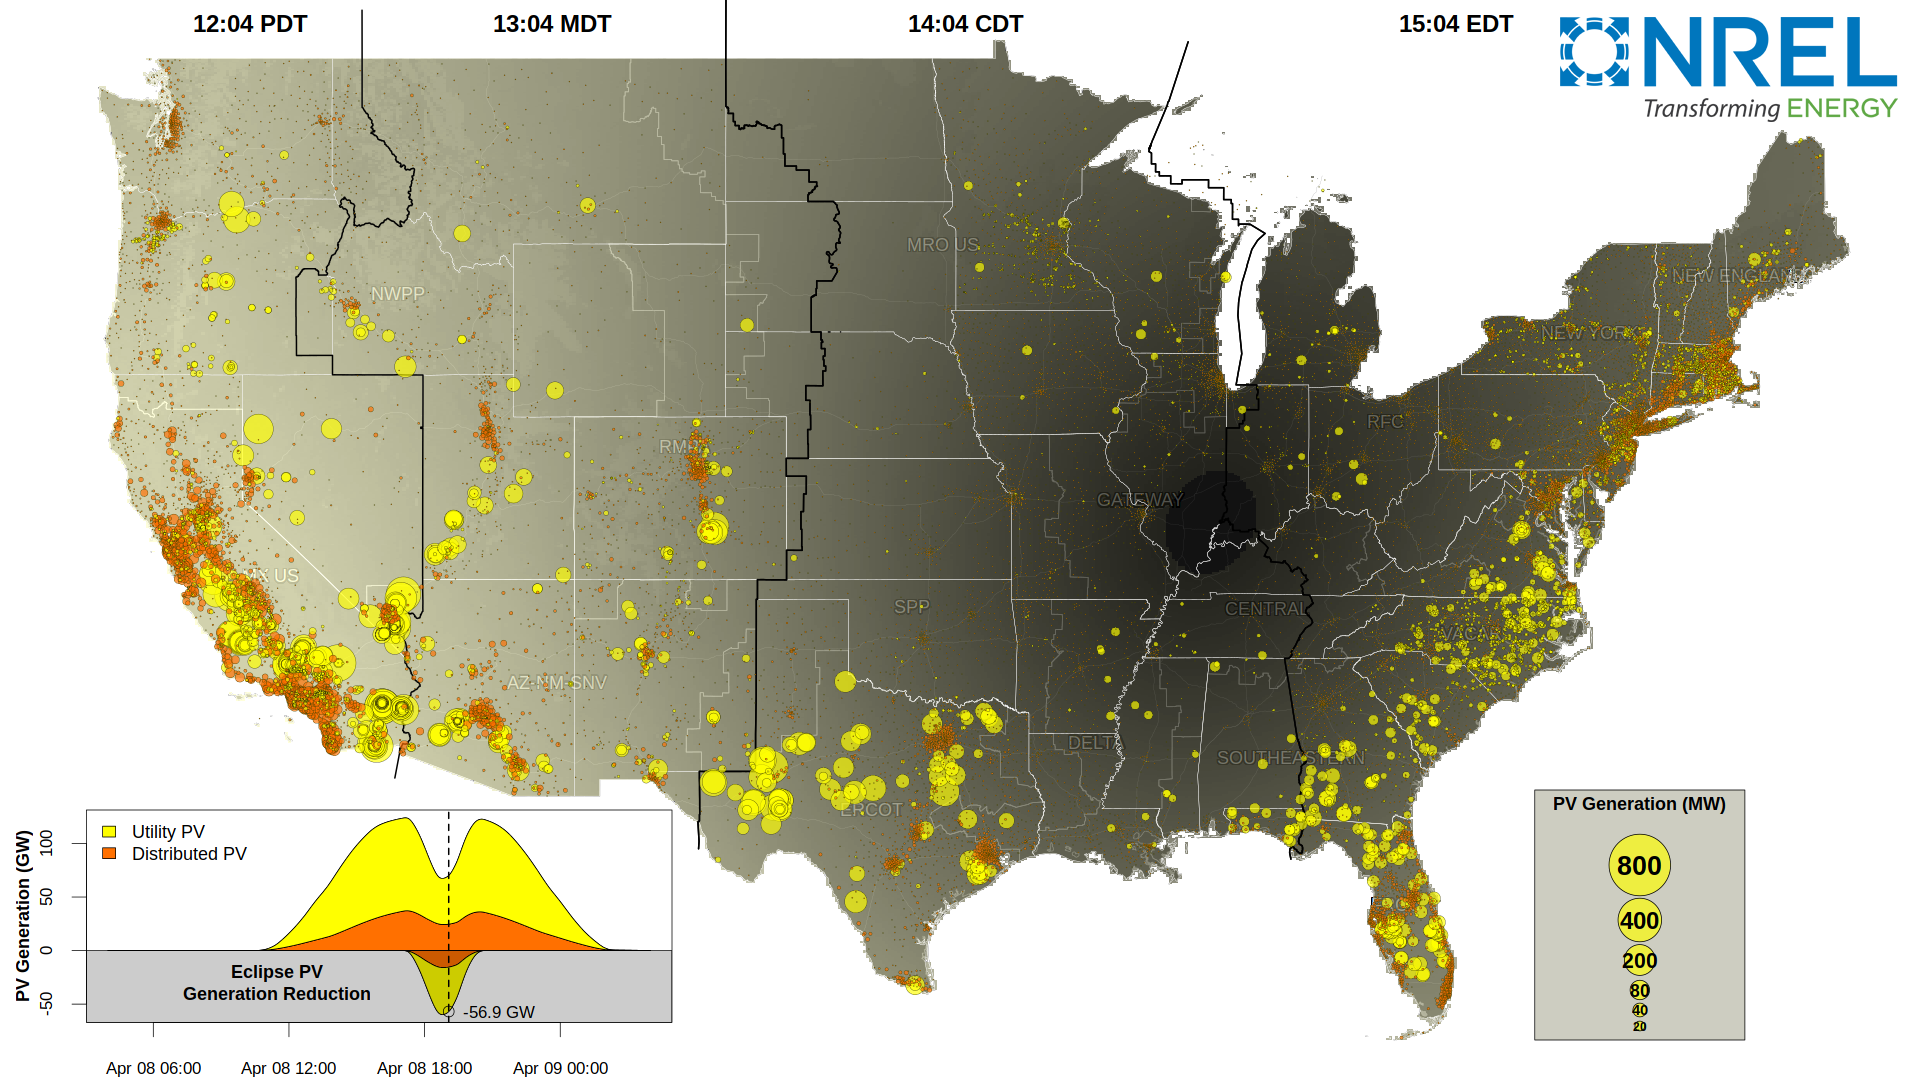
With support from the U.S. Department of Energy Solar Energy Technologies Office, and in collaboration with the North American Electric Reliability Corp., NREL has studied the extent of reduction in solar generation during the eclipse, across the country. The visualization shows the clear-sky impacts to utility-scale PV (yellow) and distribution PV (orange).
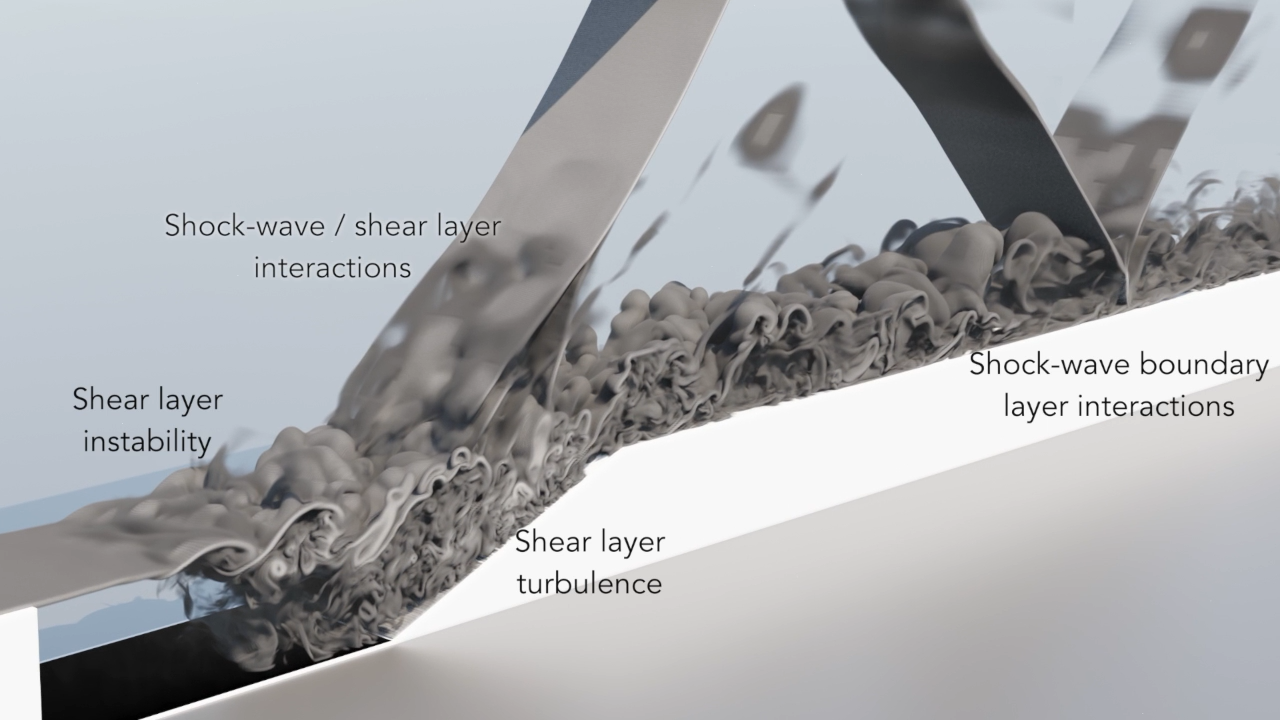
In a scramjet engine, supersonic flows and short residence times make combustion challenging. Cavity flame holders are necessary to achieve adequate mixing and flame stabilization. We perform high-fidelity combustion simulations to understand direct fuel injection effects. Air flows in at Mach 1.5, at a temperature of 1000K and 1 atm of pressure. We explore two hydrogen fuel injection strategies: floor injection near the step, and floor injection near the ramp. The reacting flow solver, PeleC, drives the simulation on the Eagle HPC at NREL. Adaptive mesh refinement provides higher resolutions and reduces compute resource requirements. Near-step injection provides higher peak temperatures and richer combustion with heat-release and pressure variation correlated in time. While the near-ramp injection has greater fuel mixing and lower peak temperatures. Identification of these important physical phenomena in flame-holder mechanisms will pave the way to efficient direct fuel injection strategies.
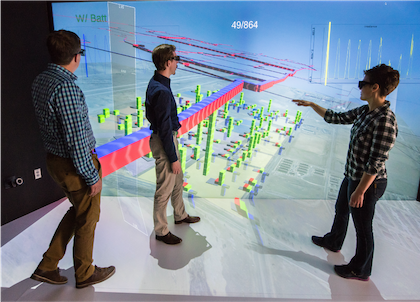
To help stakeholders and developers prepare for Peña Station NEXT, Denver’s forthcoming, airport-abutting smart community, engineers and computer scientists at NREL have created an immersive planning environment at the laboratory’s Insight Center. Like the community itself, NREL’s visualization tool is a revolution in how we interact with tomorrow’s power systems.
Geometry-resolved large-eddy simulation of the NREL 5MW wind turbine, which shows velocity isosurfaces at 5.5 m/s after three rotor revolutions. Simulation was performed on the NERSC Cori system with Nalu-Wind, which is an unstructured-grid, low-Mach-Number computational fluid dynamics code (CFD). Code development and simulations are being performed as part of the DOE ExaWind Exascale Computing Project (ECP) and the DOE EERE Wind Energy Technologies Office High-Fidelity Modeling project
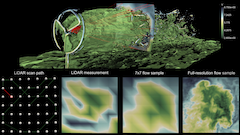
Wind-plant operators would like to better control wind turbines to mitigate the wake effects between turbines, as the wakes that form behind upstream wind turbines can have significant impacts on the performance of downstream turbines. However, in order to make sound adjustments, operators need data charting the relationship between the degree of the adjustment and the resulting wake deflection. Light Detection and Ranging (LiDAR) technology, which can be programmed to measure atmospheric velocity, may be able to generate enough data to make such adjustments feasible in real-time. However, LiDAR only provides a low spatial and temporal fidelity measurement, and how accurately that measurement represents a turbine wake has not been established. To better understand the efficacy of using LiDAR to measure the wake trailing a wind turbine, we have used high-fidelity computational fluid dynamics (CFD) to simulate a wind turbine in turbulent flow, and simulate LiDAR measurements in this high-fidelity flow. A visual analysis of the LiDAR measurement in the context of the high-fidelity wake clearly illustrates the limitations of the LiDAR resolution and contributes to the overall comprehension of LiDAR operation.
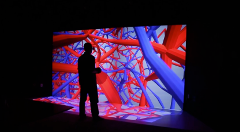
The Insight Center at the National Renewable Energy Laboratory (NREL) combines state-of-the-art visualization and collaboration tools to promote knowledge discovery in energy systems integration. Located adjacent to NREL’s high-performance computing data center, the Insight Center uses advanced visualization technology to provide on-site and remote viewing of experimental data, high-resolution visual imagery and large-scale simulation data.
As the United States moves toward utilizing more of its wind and water resources for electrical power generation, computational modeling will play an increasingly important role in improving the performance, decreasing costs, and accelerating deployment of wind and water power technologies. We are developing computational models to better understand the wake effects of wind and marine hydrokinetic turbines, which operate on the same principles. Large wind plants are consistently found to perform below expectations. Inadequate accounting various turbulent-wake effects is believed to be in part responsible for the under-performance.
Fluidized bed reactors are a promising technology for the thermo-chemical conversion of biomass in biofuel production. However, the current understanding of the behavior of the materials in a fluidized bed is limited. We are using high-fidelity simulations to better understand the mechanics of the conversion processes. This video visualizes a simulation of a periodic bed of sand fluidized by a gas stream injected at the bottom. A Lagrangian approach describes the solid phase, in which particles with a soft-sphere collision model are individually tracked along the reactor. A large-scale point-particle direct numerical simulation involving 12 millions particles and 4 million mesh points has been performed, requiring 512 cores for 4 days. The onset of fluidization is characterized by the formation of several large bubbles that rise and burst at the surface and is followed by a pseudo-steady turbulent motion showing intense bubble activity.
A detailed numerical simulation of a turbulent liquid jet. Atomization of liquid fuel is the process by which a coherent liquid flow disintegrates in droplets. Understanding atomization will have far reaching repercussions on many aspects of the combustion process. This was a large-scale scaling study run on Red Mesa, , involving 1.36 billion cells, run on 12,228 cores, rendered on 1,248.
Selected Press
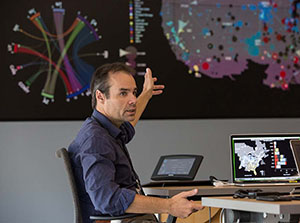
To NRELians, he’s known by many names. He’s the guy with the 3D goggles. He’s the creator of “the cave.” He’s the silhouette of record. To his peers, he’s the visualization guru. But to most, he’s simply Kenny.
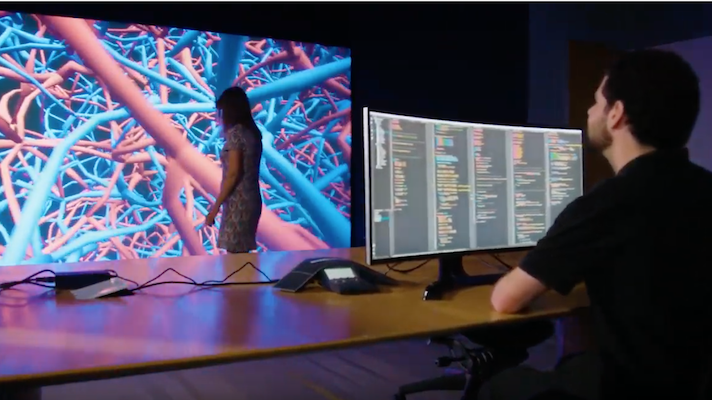
As more and more data are generated, scientific visualization is becoming increasingly important to energy research. NREL data scientist Kenny Gruchalla designed and built a visualization cave inside NREL’s Energy Systems Integration Facility to help researchers explore their data in new ways and understand their research from new perspectives. This capability is helping move the needle on high-impact projects dealing with complex, large-scale data.
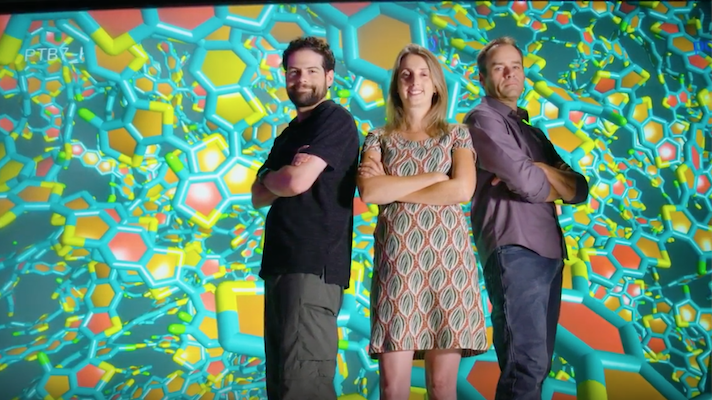
Scientific visualization capabilities help move the needle on high-impact projects dealing with complex, large-scale data. Meet Kenny, Kristi, and Nicholas, the experienced team responsible for bringing that data to life inside NREL’s unique Energy Systems Integration Facility, where the visualization cave allows researchers to step inside their projects to experience and interact with their data on a new level.
“A data visualization specialist named Kenny Gruchalla noticed something that didn’t make sense…”
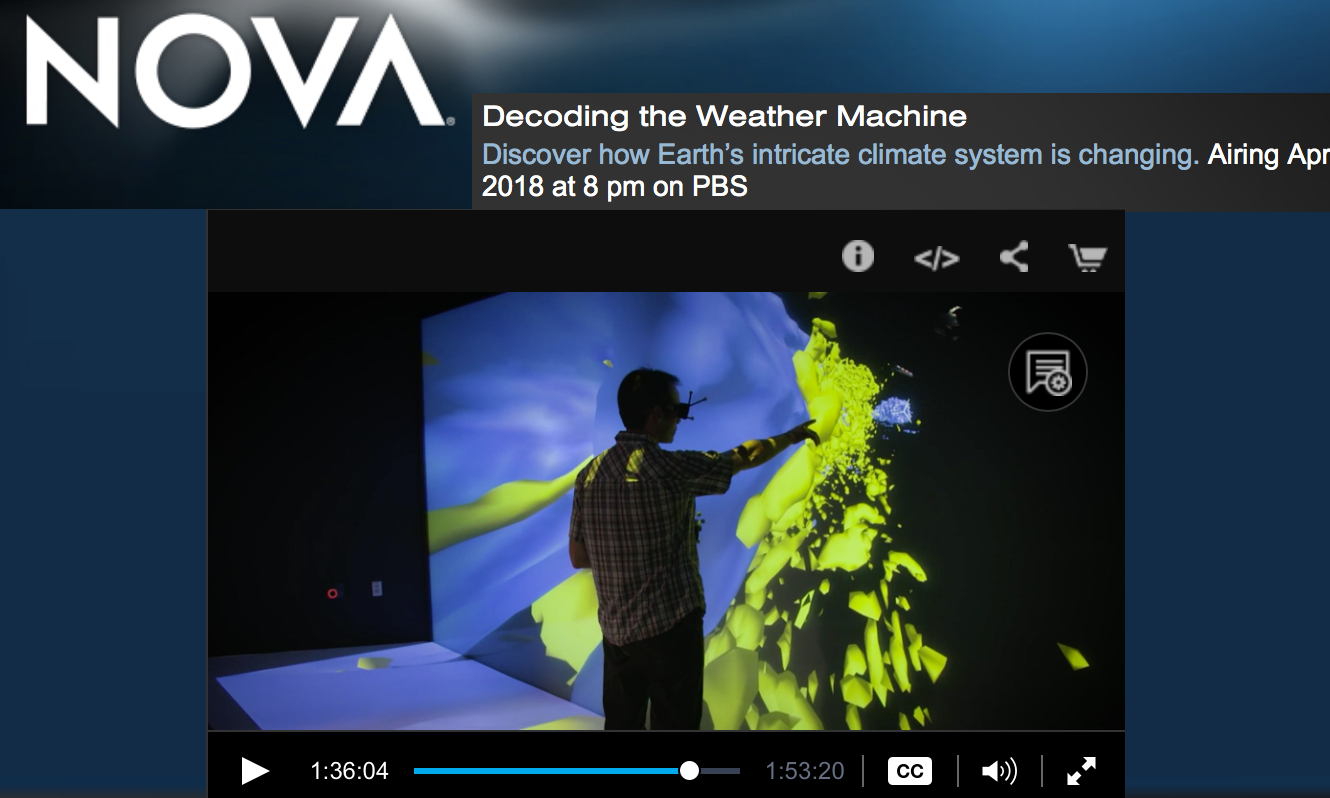
Disastrous hurricanes. Widespread droughts and wildfires. Withering heat. Extreme rainfall. It is hard not to conclude that something’s up with the weather, and many scientists agree. It’s the result of the weather machine itself—our climate—changing, becoming hotter and more erratic. In this 2-hour documentary, NOVA will cut through the confusion around climate change.
