In conjunction with IEEE VIS 2024, in St. Pete Beach, FL, USA. The energy sector is witnessing significant technological progress, primarily driven by the growth of renewable energy, distributed energy resources, and smart grid technologies. This rapid evolution is generating increasingly large, complex data that present substantial challenges for energy systems planning and operations. For example, previously, distribution feeders had only a handful of sensors and controllable devices; now, with these new technologies, thousands or even tens of thousands of such devices are possible. As a result, energy system models have grown exponentially in planning scenarios from just hundreds of components to millions. Moreover, the adoption of distributed solar generation and grid-aware devices such as smart thermostats and electric vehicles are expanding the breadth of stakeholders, including consumers, engineers, regulators, urban planners, and policymakers, who are trying to understand these energy systems. These new energy systems are generating vast amounts of complex data, which require visualization techniques capable of handling the sheer scale and multifaceted complexity of the information. Unfortunately, much of the visualization supporting these changes is outdated, with simple one-line diagrams and contour plots being over-extended by the data they are being applied to. More research is needed to develop new and innovative visualization methods that can handle the increasing complexity of energy systems and provide a diversity of stakeholders with the necessary insights to make informed decisions about the future of energy. The EnergyVis 2024 workshop aims to bring together scientists, researchers, and practitioners from the energy and visualization domains to critically assess and discuss energy data visualization in the context of the evolving energy sector. . This year’s workshop will be theme around decision support.
Kenny Gruchalla, Ph.D.
Principal Scientist & Distinguished Member of Research Staff, National Renewable Energy LaboratoryAssistant Professor Adjoint, Computer Science, University of Colorado at Boulder
Affiliate Faculty, RDC, Colorado State University
National Renewable Energy Laboratory
15013 Denver West Parkway Golden, CO 80401-3305
Curriculum Vitae (pdf updated 12/14/25)
Resume (pdf updated 12/14/25)
Events

HPG2024 will be co-hosted with SIGGRAPH in Denver, Colorado on Friday July 26 through Sunday July 28. High-Performance Graphics (HPG) is the leading international forum for performance-oriented graphics and imaging systems research, including innovative algorithms, efficient implementations, languages, compilers, parallelism, and hardware architectures for high-performance graphics. The conference brings together researchers, engineers, and architects to discuss the complex interactions of parallel and custom hardware, novel programming models, and efficient algorithms in the design of systems for current and future graphics and visual computing applications.
We are pleased to announce the Call for Participation in the HPG2024 conference.
In conjunction with IEEE VIS 2023, Melbourne, Australia. The energy sector is witnessing significant technological progress, primarily driven by the growth of renewable energy, distributed energy resources, and smart grid technologies. This rapid evolution is generating increasingly large, complex data that present substantial challenges for energy systems planning and operations. For example, previously, distribution feeders had only a handful of sensors and controllable devices; now, with these new technologies, thousands or even tens of thousands of such devices are possible. As a result, energy system models have grown exponentially in planning scenarios from just hundreds of components to millions. Moreover, the adoption of distributed solar generation and grid-aware devices such as smart thermostats and electric vehicles are expanding the breadth of stakeholders, including consumers, engineers, regulators, urban planners, and policymakers, who are trying to understand these energy systems. These new energy systems are generating vast amounts of complex data, which require visualization techniques capable of handling the sheer scale and multifaceted complexity of the information. Unfortunately, much of the visualization supporting these changes is outdated, with simple one-line diagrams and contour plots being over-extended by the data they are being applied to. More research is needed to develop new and innovative visualization methods that can handle the increasing complexity of energy systems and provide a diversity of stakeholders with the necessary insights to make informed decisions about the future of energy.</p> The EnergyVis 2023 workshop aims to bring together scientists, researchers, and practitioners from the energy and visualization domains to critically assess and discuss energy data visualization in the context of the evolving energy sector.
In conjunction with ACM e-Energy 2021, (Torino, Italy) this workshop brings together scientists, researchers and practitioners from the field to discuss the many challenges and goals in regard to energy data visualization. This topic will build on the findings of the first workshop.
Recent years have seen substantial technological and analytical enhancements to the energy sector, enabling the move away from a passive and inefficient power grid network to the delivery of a smart system via sensors, monitors and other digital technologies. In parallel, we have seen advanced data analytics emerging (and being presented at core venues such as e-Energy) to explore improvements to predictions, forecasts and models throughout the industry. The emerging data from this sector is not only growing in volume but in its complexity.
Visualization as a tool for data analysis, exploration and communication has become a driving force in the task of unravelling data complexity and is crucial in helping to bridge the gap between the flood of data and ensuring decision makers can make more effective and informed decisions. Visualization and visual analytics offer a vast array of opportunities for the energy domain and we have seen a new era of ‘Energy Data Visualization’ emerge as a topic of growing importance.
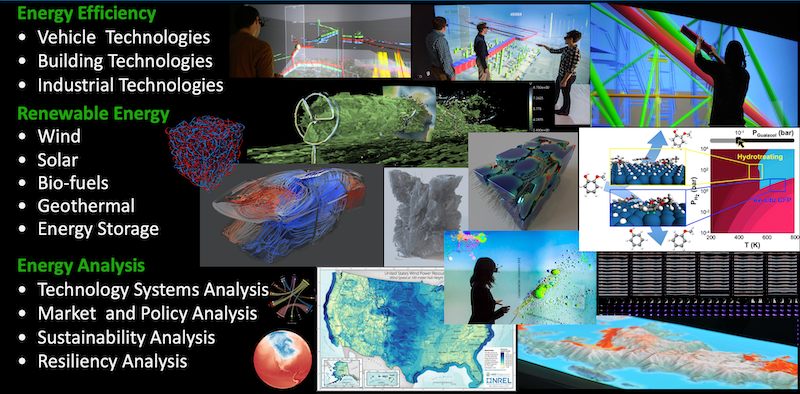
IEEE VisWeek Application Spotlight. Visualization is commonly used in the renewable energy space, not only by analysts, but also for communication to policymakers, city planners, and the general public. The scope and style of these visualizations vary based on the data and end goals. At the National Renewable Energy Laboratory, 3D immersive visualization is a prominent method for exploring spatially complex data, such as the morphology of photovoltaic materials. However, this paradigm is not appropriate for many techno-economic studies, such as investigating where to put new wind farms or the cost of adding new batteries to the power grid. In these cases, visualizations tend to be more map-based and deployed as web or desktop applications and on large scale 2D displays. While the types and data and targeted audience within this space is broad, there are some overarching themes including the relationship between cost, energy capacity, and economic and regulatory policy. These themes make both the science and visualization more complicated, forcing simulations to integrate energy engineering with policy and economics and to visualize multitudes of scenarios simultaneously. In this spotlight, we will give a primer to the varied types of energy technologies within this space as well as common visualization strategies for these types. We will then dive into 4-5 lightning talks on visualization systems that are pushing state of the art and changing how renewable energy is created, deployed and utilized.

The U.S. Department of Energy (DOE) Computer Graphics Forum, which has been an annual event since the mid-1970s, is a venue where government-sponsored computer graphics/scientific visualization scientists, engineers, and practitioners have the opportunity to share recent research, development, and deployment results. While the participants are primarily from DOE laboratories and DOE-funded universities, the forum has welcomed participants who are funded by other government agencies (e.g., Department of Defense, National Science Foundation) to perform graphics and visualization work. While there are other venues for presenting and discussing graphics/visualization research, such as Siggraph and IEEE Visualization, the DOE labs, with their emphasis on extreme-scale computation, face unique challenges in visualization and data understanding. Thus, over the years, the forum has proven invaluable for sharing information and experiences, building cross-institutional collaborations, and coordinating efforts across programs.
The U.S. Department of Energy (DOE) Computer Graphics Forum, which has been an annual event since the mid-1970s, is a venue where government-sponsored computer graphics/scientific visualization scientists, engineers, and practitioners have the opportunity to share recent research, development, and deployment results. While the participants are primarily from DOE laboratories and DOE-funded universities, the forum has welcomed participants who are funded by other government agencies (e.g., Department of Defense, National Science Foundation) to perform graphics and visualization work. While there are other venues for presenting and discussing graphics/visualization research, such as Siggraph and IEEE Visualization, the DOE labs, with their emphasis on extreme-scale computation, face unique challenges in visualization and data understanding. Thus, over the years, the forum has proven invaluable for sharing information and experiences, building cross-institutional collaborations, and coordinating efforts across programs.
Professional
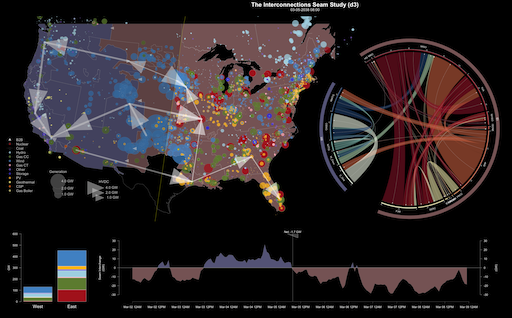
The three major components of the U.S. power system—the Western Interconnection, the Eastern Interconnection, and the Electric Reliability Council of Texas—operate almost independently of each other. Very little electricity is transferred between the interconnections due to limited transfer capacity. This study quantifies the costs and benefits of strengthening the connection (or seam) between the Eastern and Western Interconnections to encourage efficient development and utilization of U.S. energy resources.
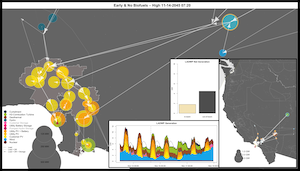
NREL provided rigorous, integrated engineering-economic analysis to the Los Angeles Department of Water and Power (LADWP) through the Los Angeles 100% Renewable Energy Study (LA100). Results show that meeting LA’s goal of reliable, 100% renewable electricity by 2045—or even 2035—is achievable and will entail rapid deployment of wind, solar, and storage technologies this decade. At the direction of the Los Angeles City Council, LA embarked on a plan to modernize its electricity system infrastructure—aiming for a 100% renewable energy supply by 2045, along with aggressive electrification targets for buildings and vehicles.
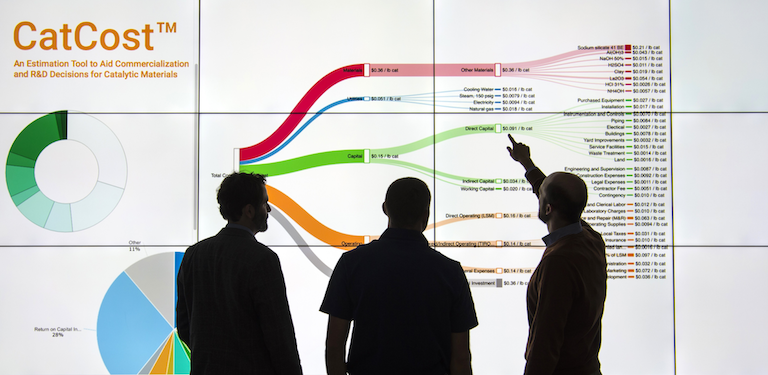
CatCost is a state-of-the-art cost estimation tool designed to reduce the cost uncertainty associated with pre-commercial catalyst materials. The tool combines industry-standard cost estimation methods and resources into an intuitive suite of tools to bring actionable cost insight to every step of catalyst research and development. CatCost™ allows the rapid development of comprehensive catalyst cost estimates. It incorporates detailed insight into manufacturing methods, especially for precommercial catalysts, without requiring any process design experience.
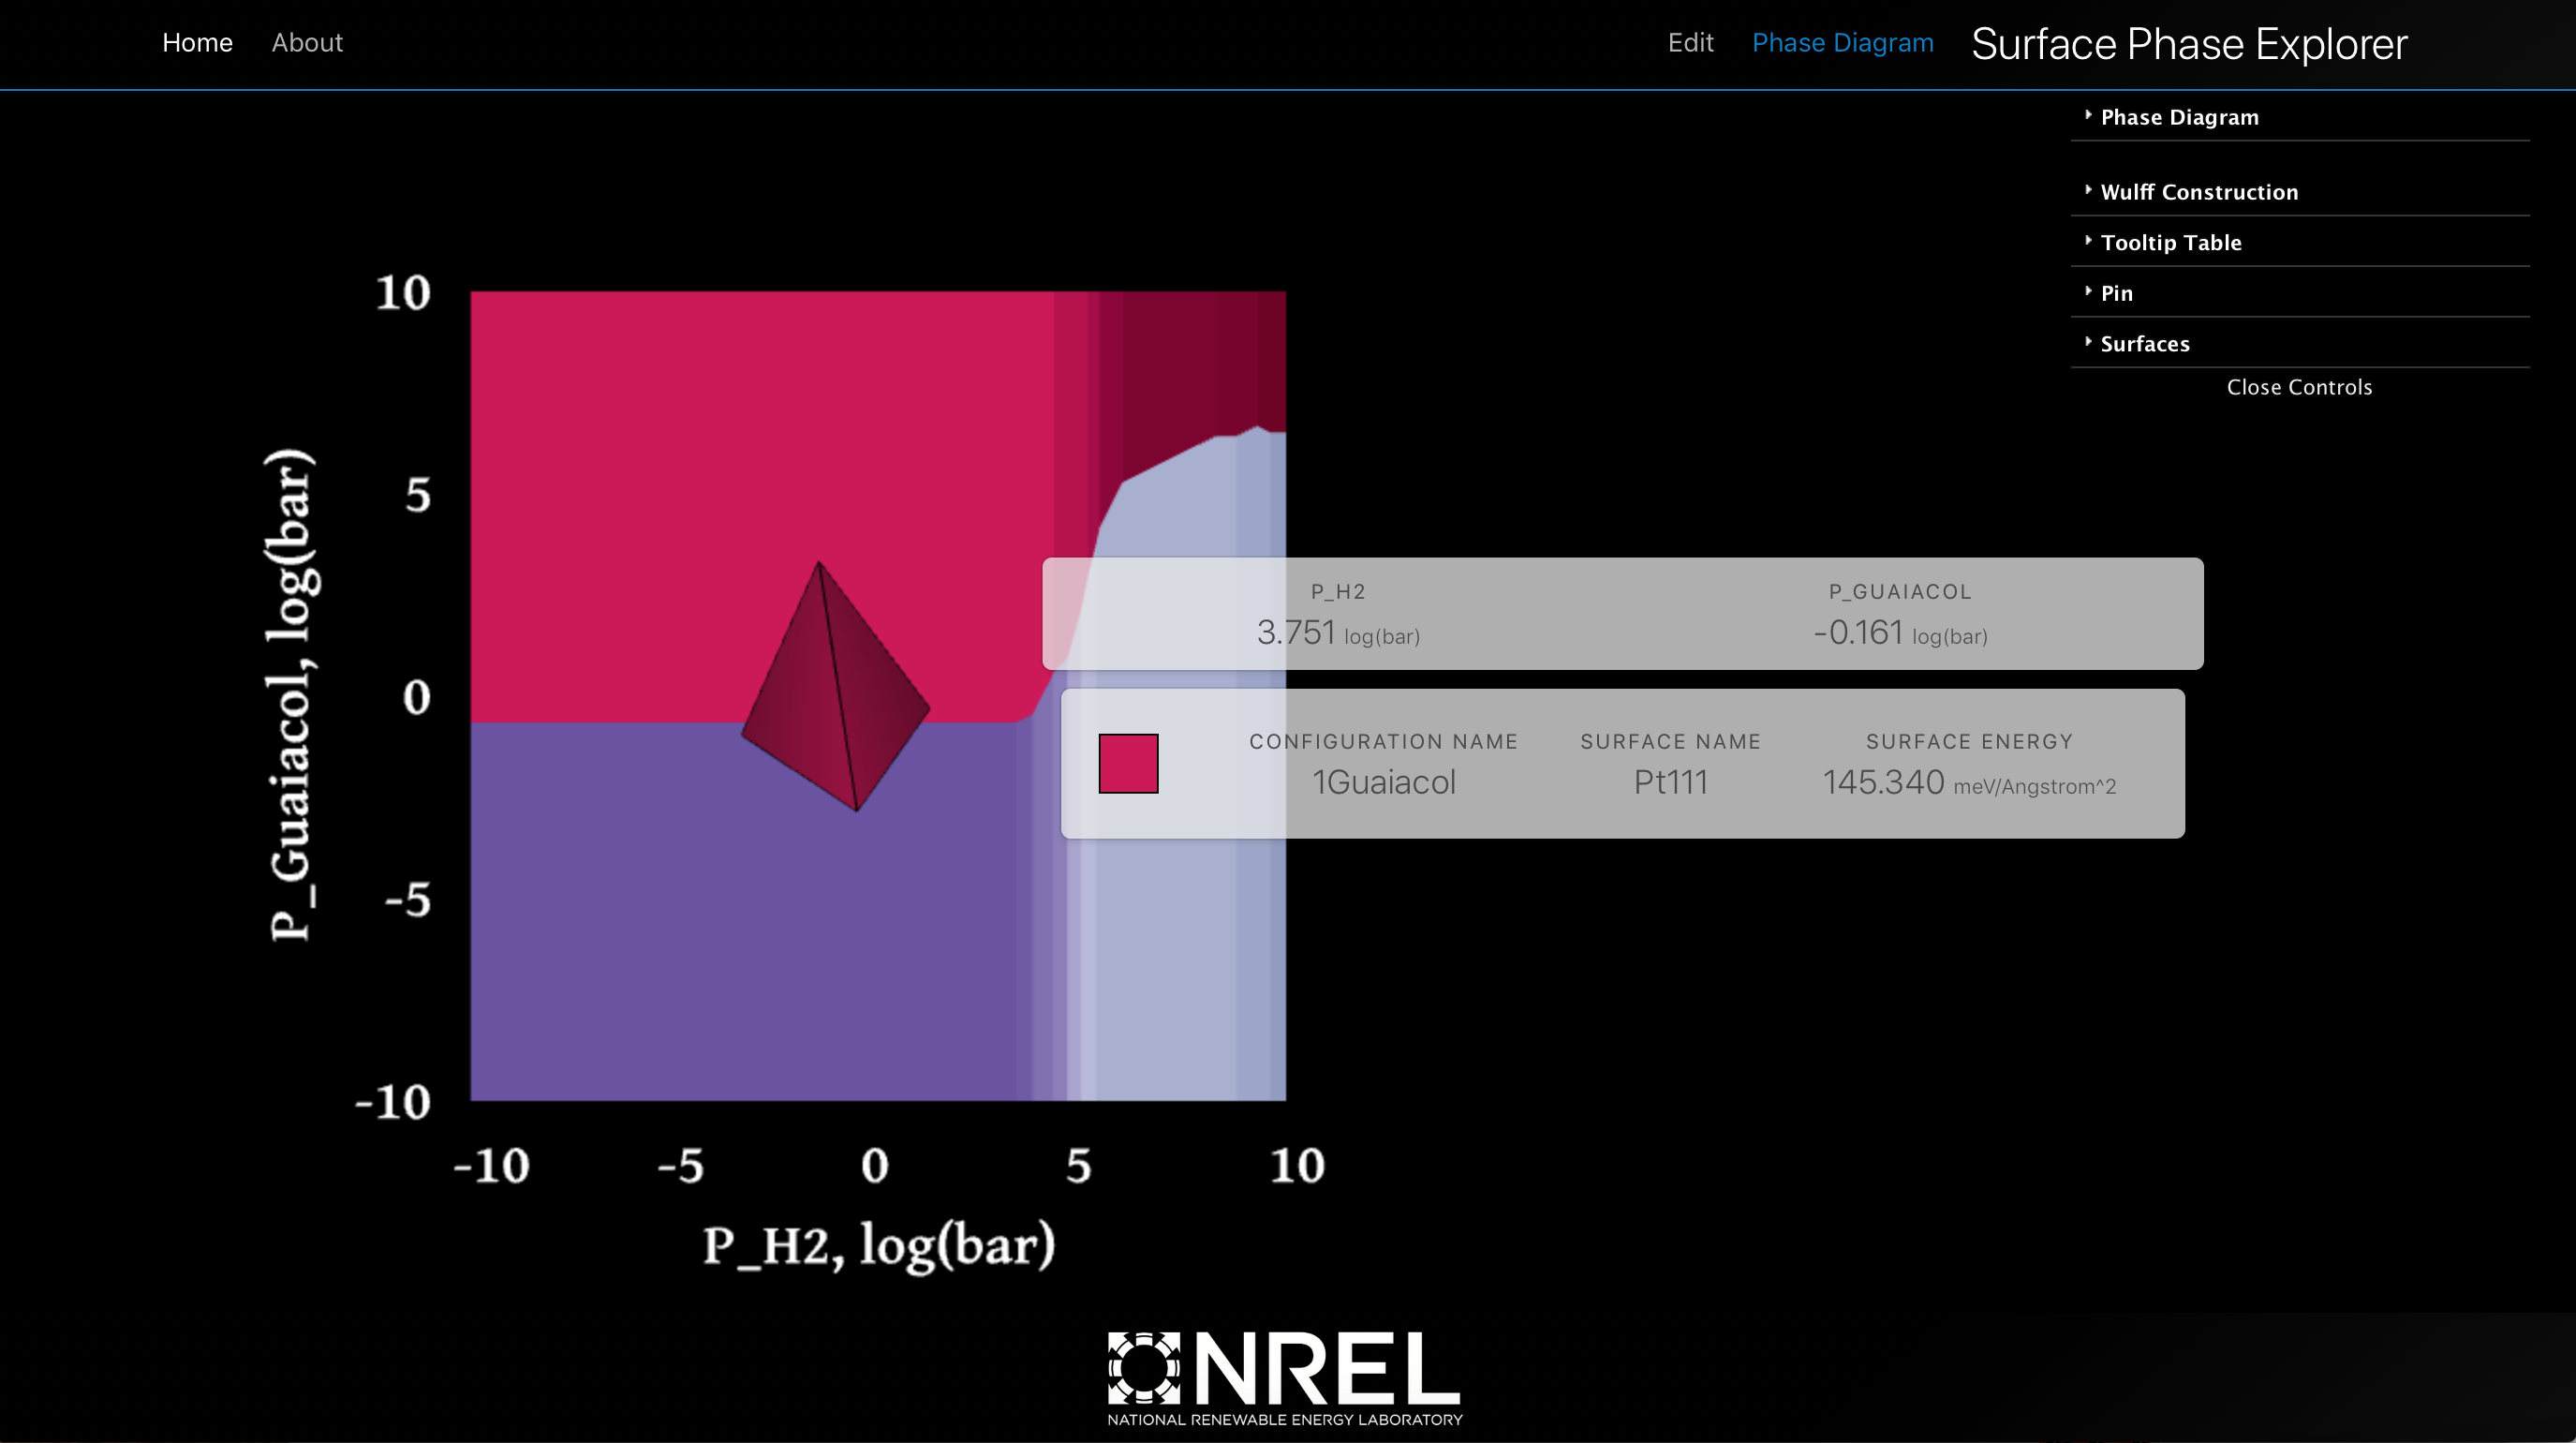
Understanding the coadsorption of two species on a surface requires the exploration of phase diagrams. To facilitate exploration this web tool creates interactive and downloadable phase diagrams from ab initio data. With SPE it is possible to create surface ab initio phase diagrams for single species adsorbing to a surface as well as coadsorption of two species to a surface, and visualize the Wulff Construction of the surface at any temperature and pressure. Explore the entire temperature and pressure range for all adsorbates using interactive and downloadable charts.
Personal

Personal collection of sand digital microscopy.
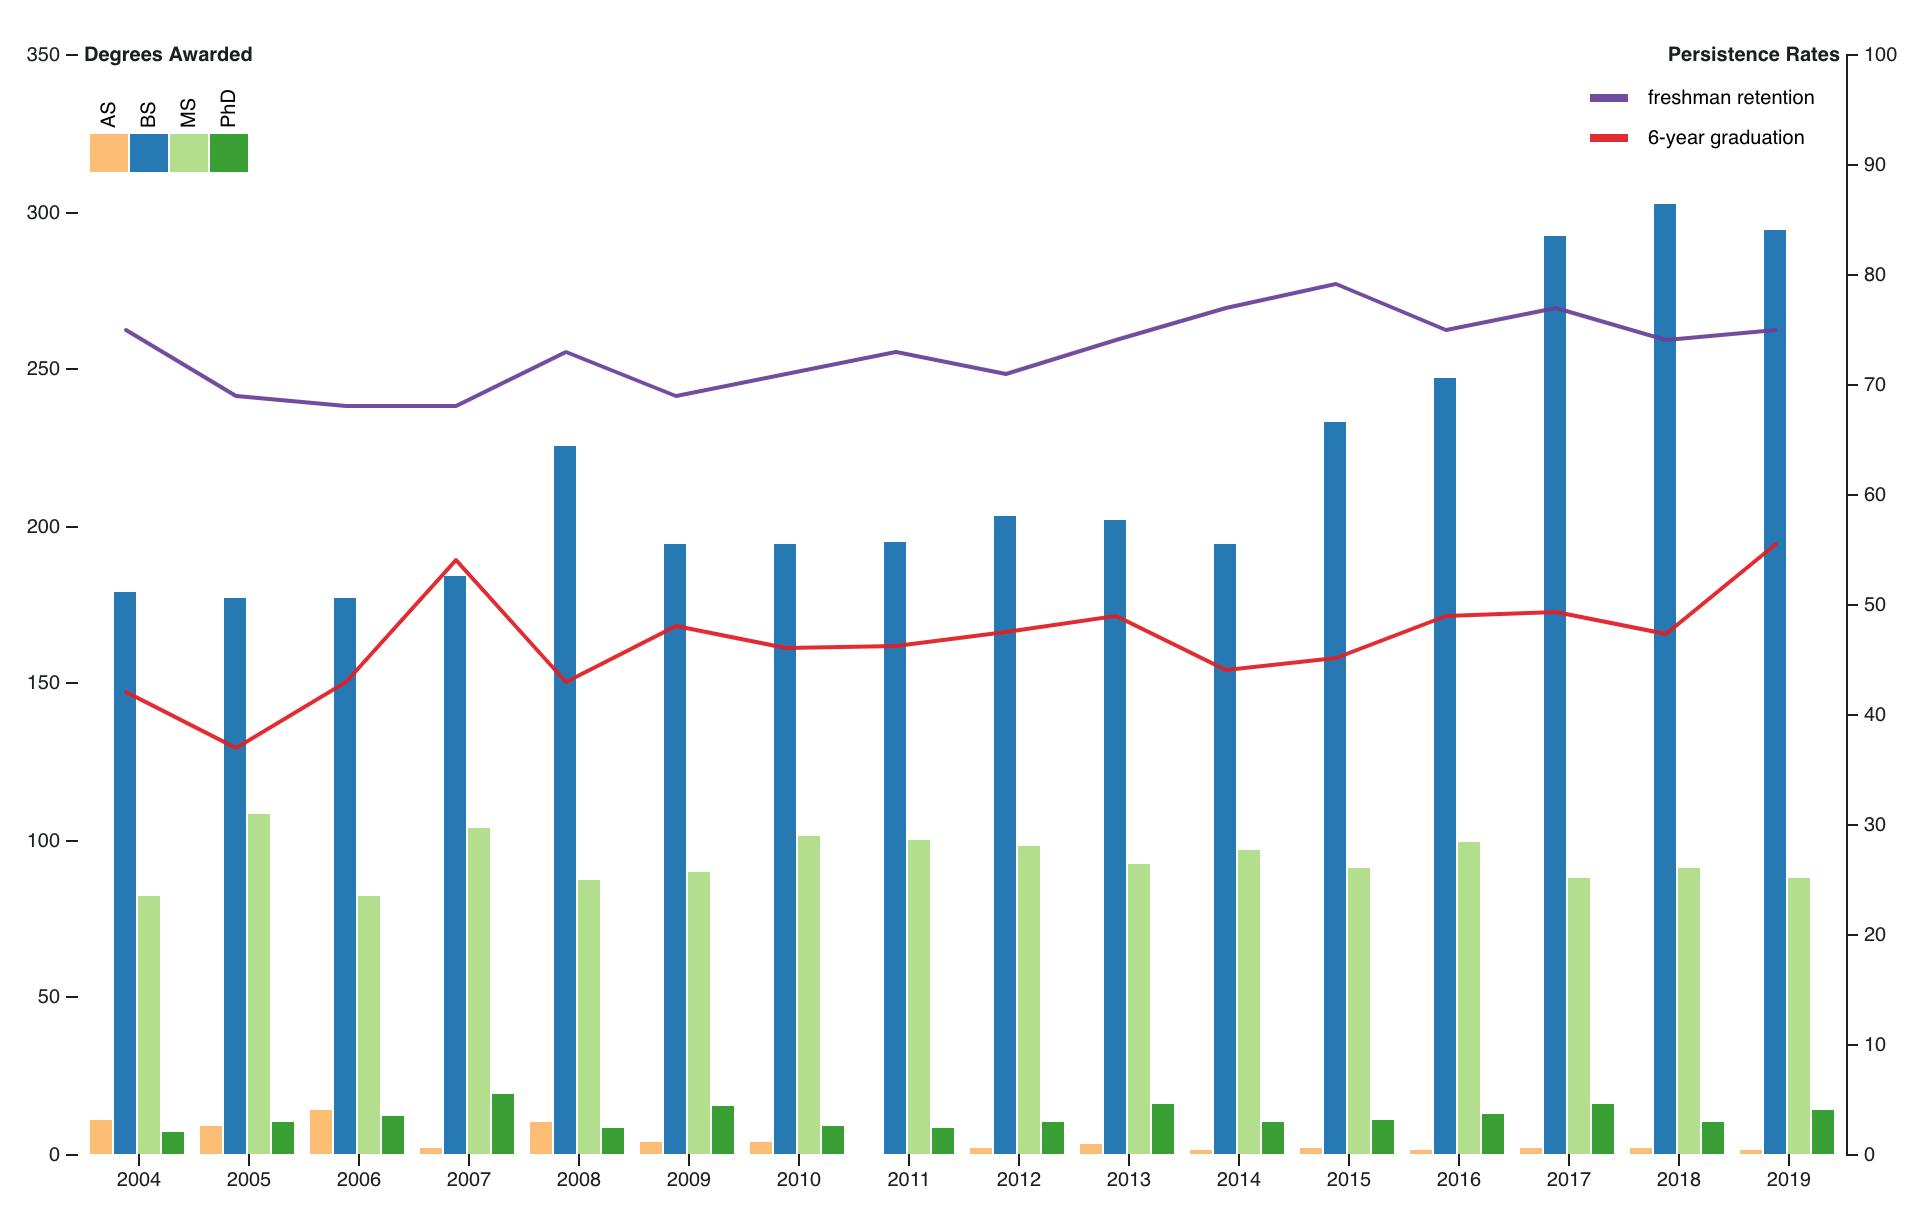
An Observable notebook examining the NMT Common Data Sets from 2004-2019, focusing on enrollment, persistence, and tuition. The notebook was developed in response to discussion on the NMT Alumni Group.
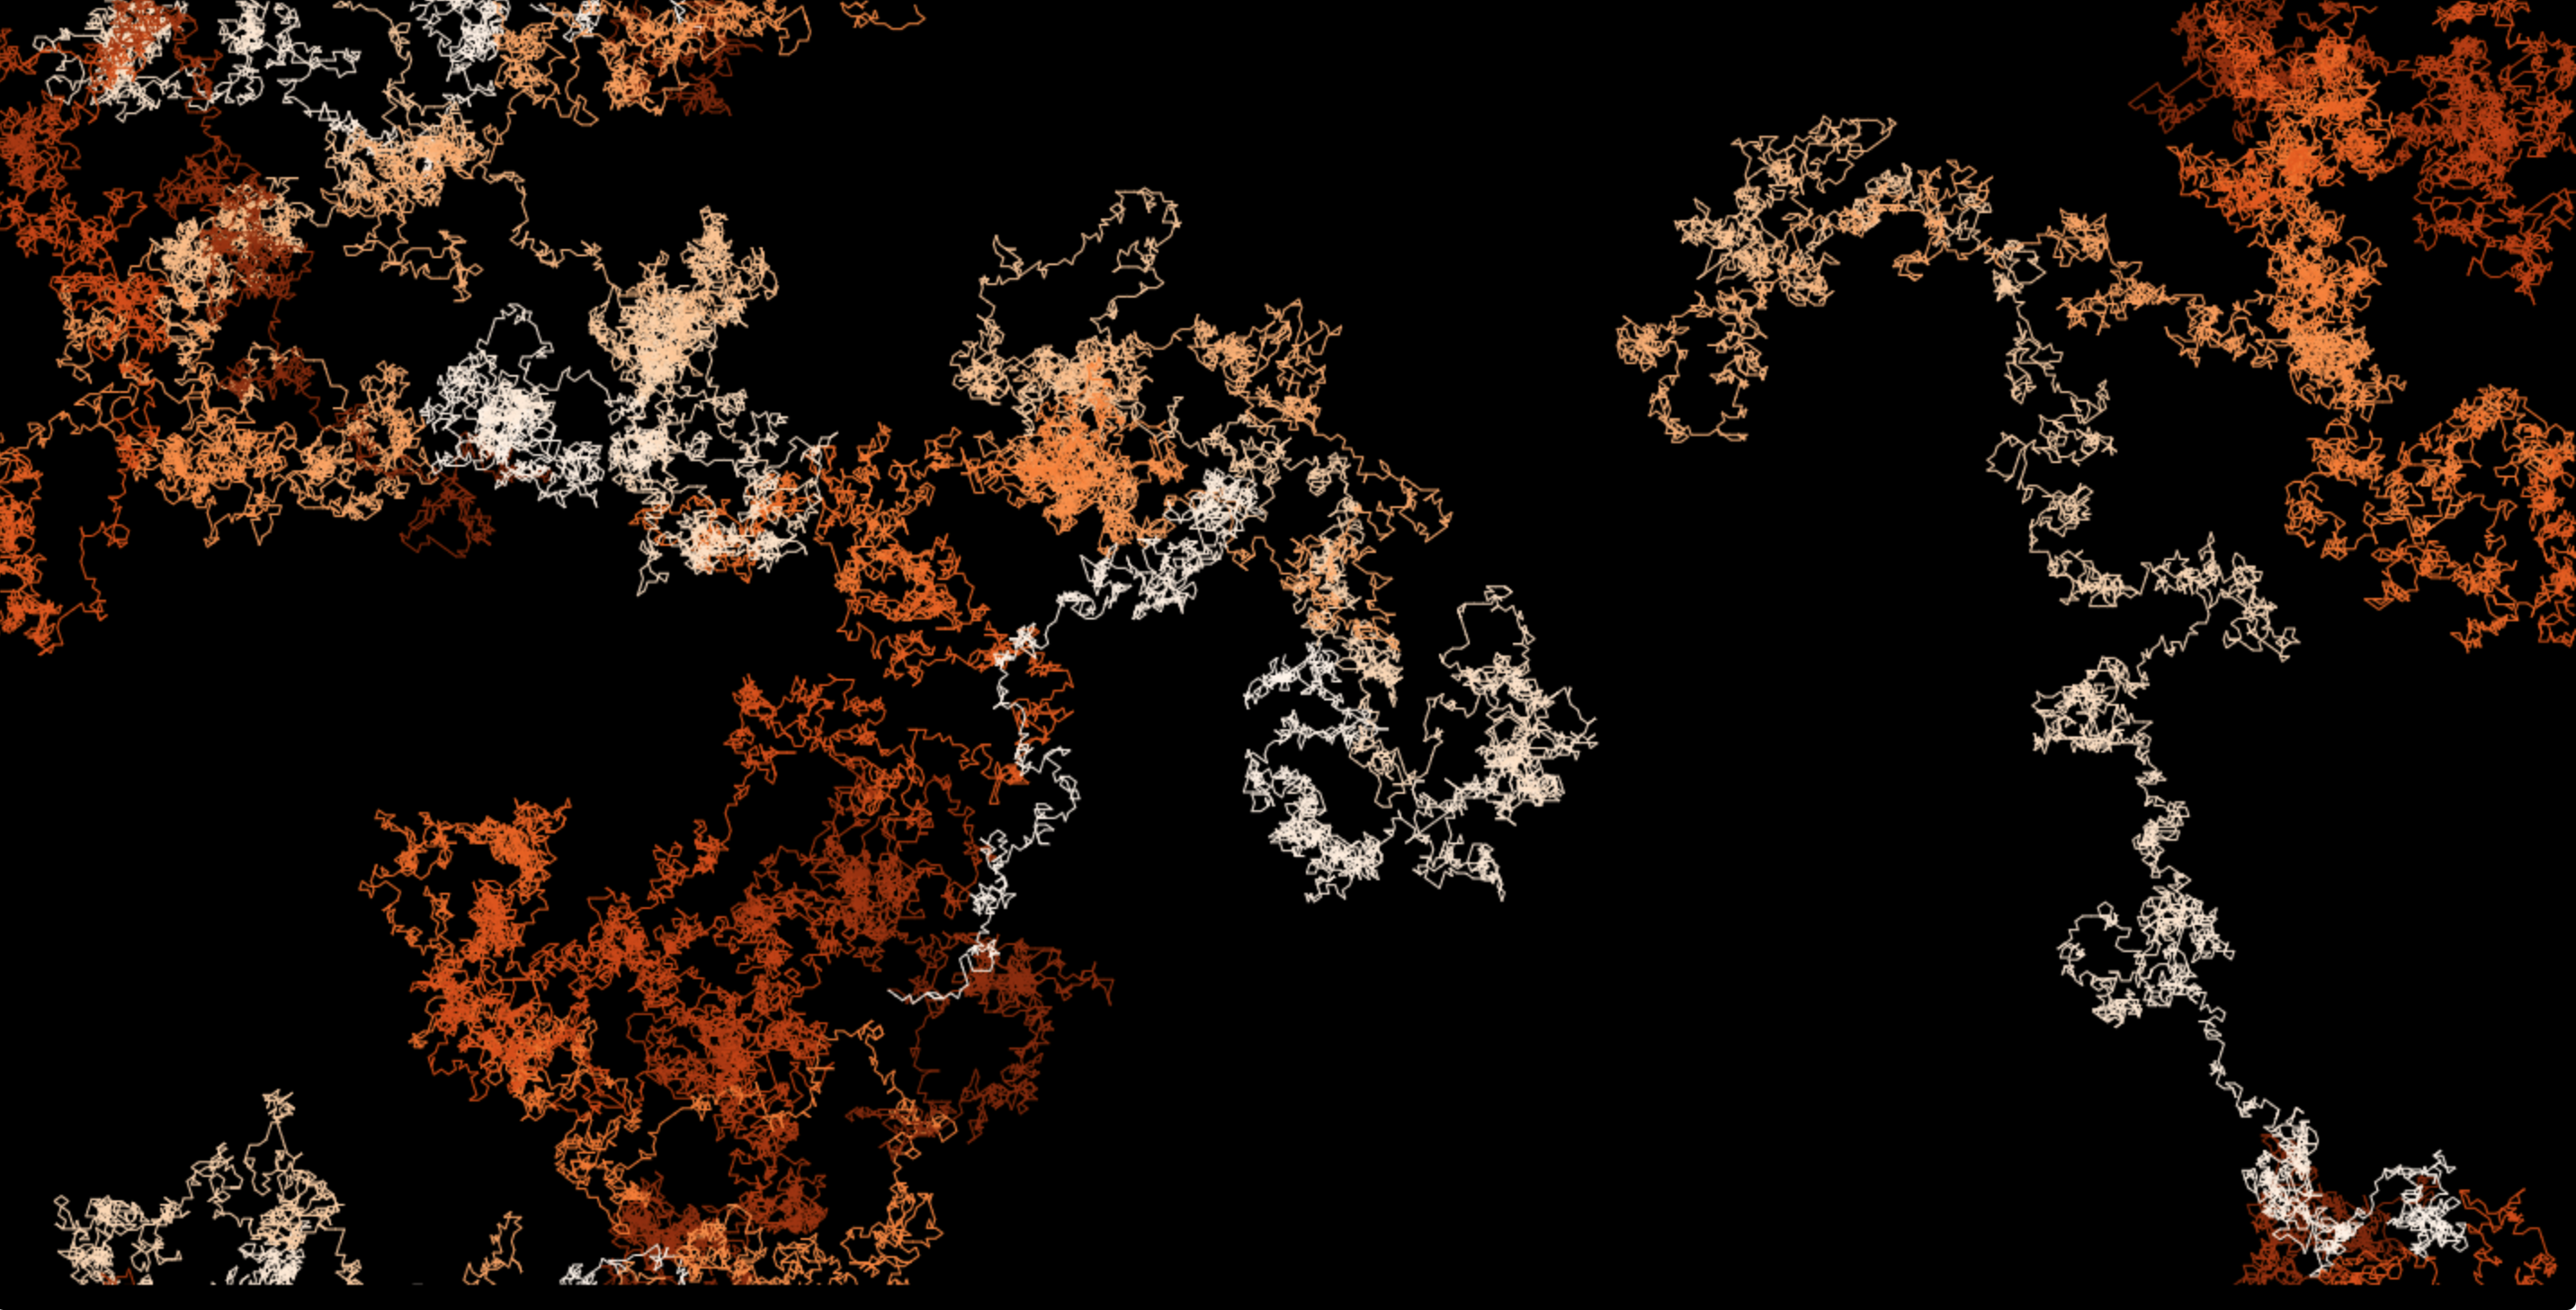
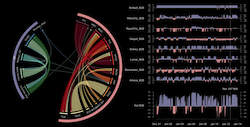
The visualization shows a deterministic walk generated by the first 100,000 digit expansion of π. The walk takes a step in one of ten 36° increments depending on the digit. The colormap repeats every 10,000 digits.